Actionable Security Intelligence
Data is widely available. What is scarce is the ability to extract actionable intelligence from it. Palo Alto Networks® next-generation firewalls have multiple features, such as the Application Command Center, Log Monitor and reporting, that provide actionable intelligence. The ACC is an analytical tool that provides information on activity within your network, eliminating clutter and providing a visual, interactive display of network insights and threats.
Using the ACC, you can understand traffic trends and various risks, such as the number of threats detected for the most active and high-risk applications, and the number of threats identified in applications at each risk level. The log monitoring and reporting capabilities provide a detailed view into your network traffic that you can customize to fit the task at hand.
Having actionable, well-organized information about network traffic and threats at your fingertips is crucial. IT and security teams are inundated with unmanageable amounts of uncorrelated data from multiple independent security deployments, making it impossible to find critical threats buried in mountains of intelligence.
Frequently, it is not a lack of data that leads to a breach, but a lack of appropriately prioritized and actionable data. IT teams have too many data sources to manage. Security teams don't have the time or resources to correlate threats in the flood of data. Both teams are too overwhelmed to find the needle in the haystack and, as a result, can't prioritize their responses appropriately.
This white paper highlights the capabilities of Palo Alto Networks firewalls to make critical information visible and actionable. It showcases the power of a highly visual, interactive and customizable user interface that reduces the need for manual data mining and offers actionable insights. We will also discuss how Panorama™ network security management provides ACC and Log Management capabilities to bring security teams a single pane of glass for actionable visibility across multiple devices, no matter where they are deployed.
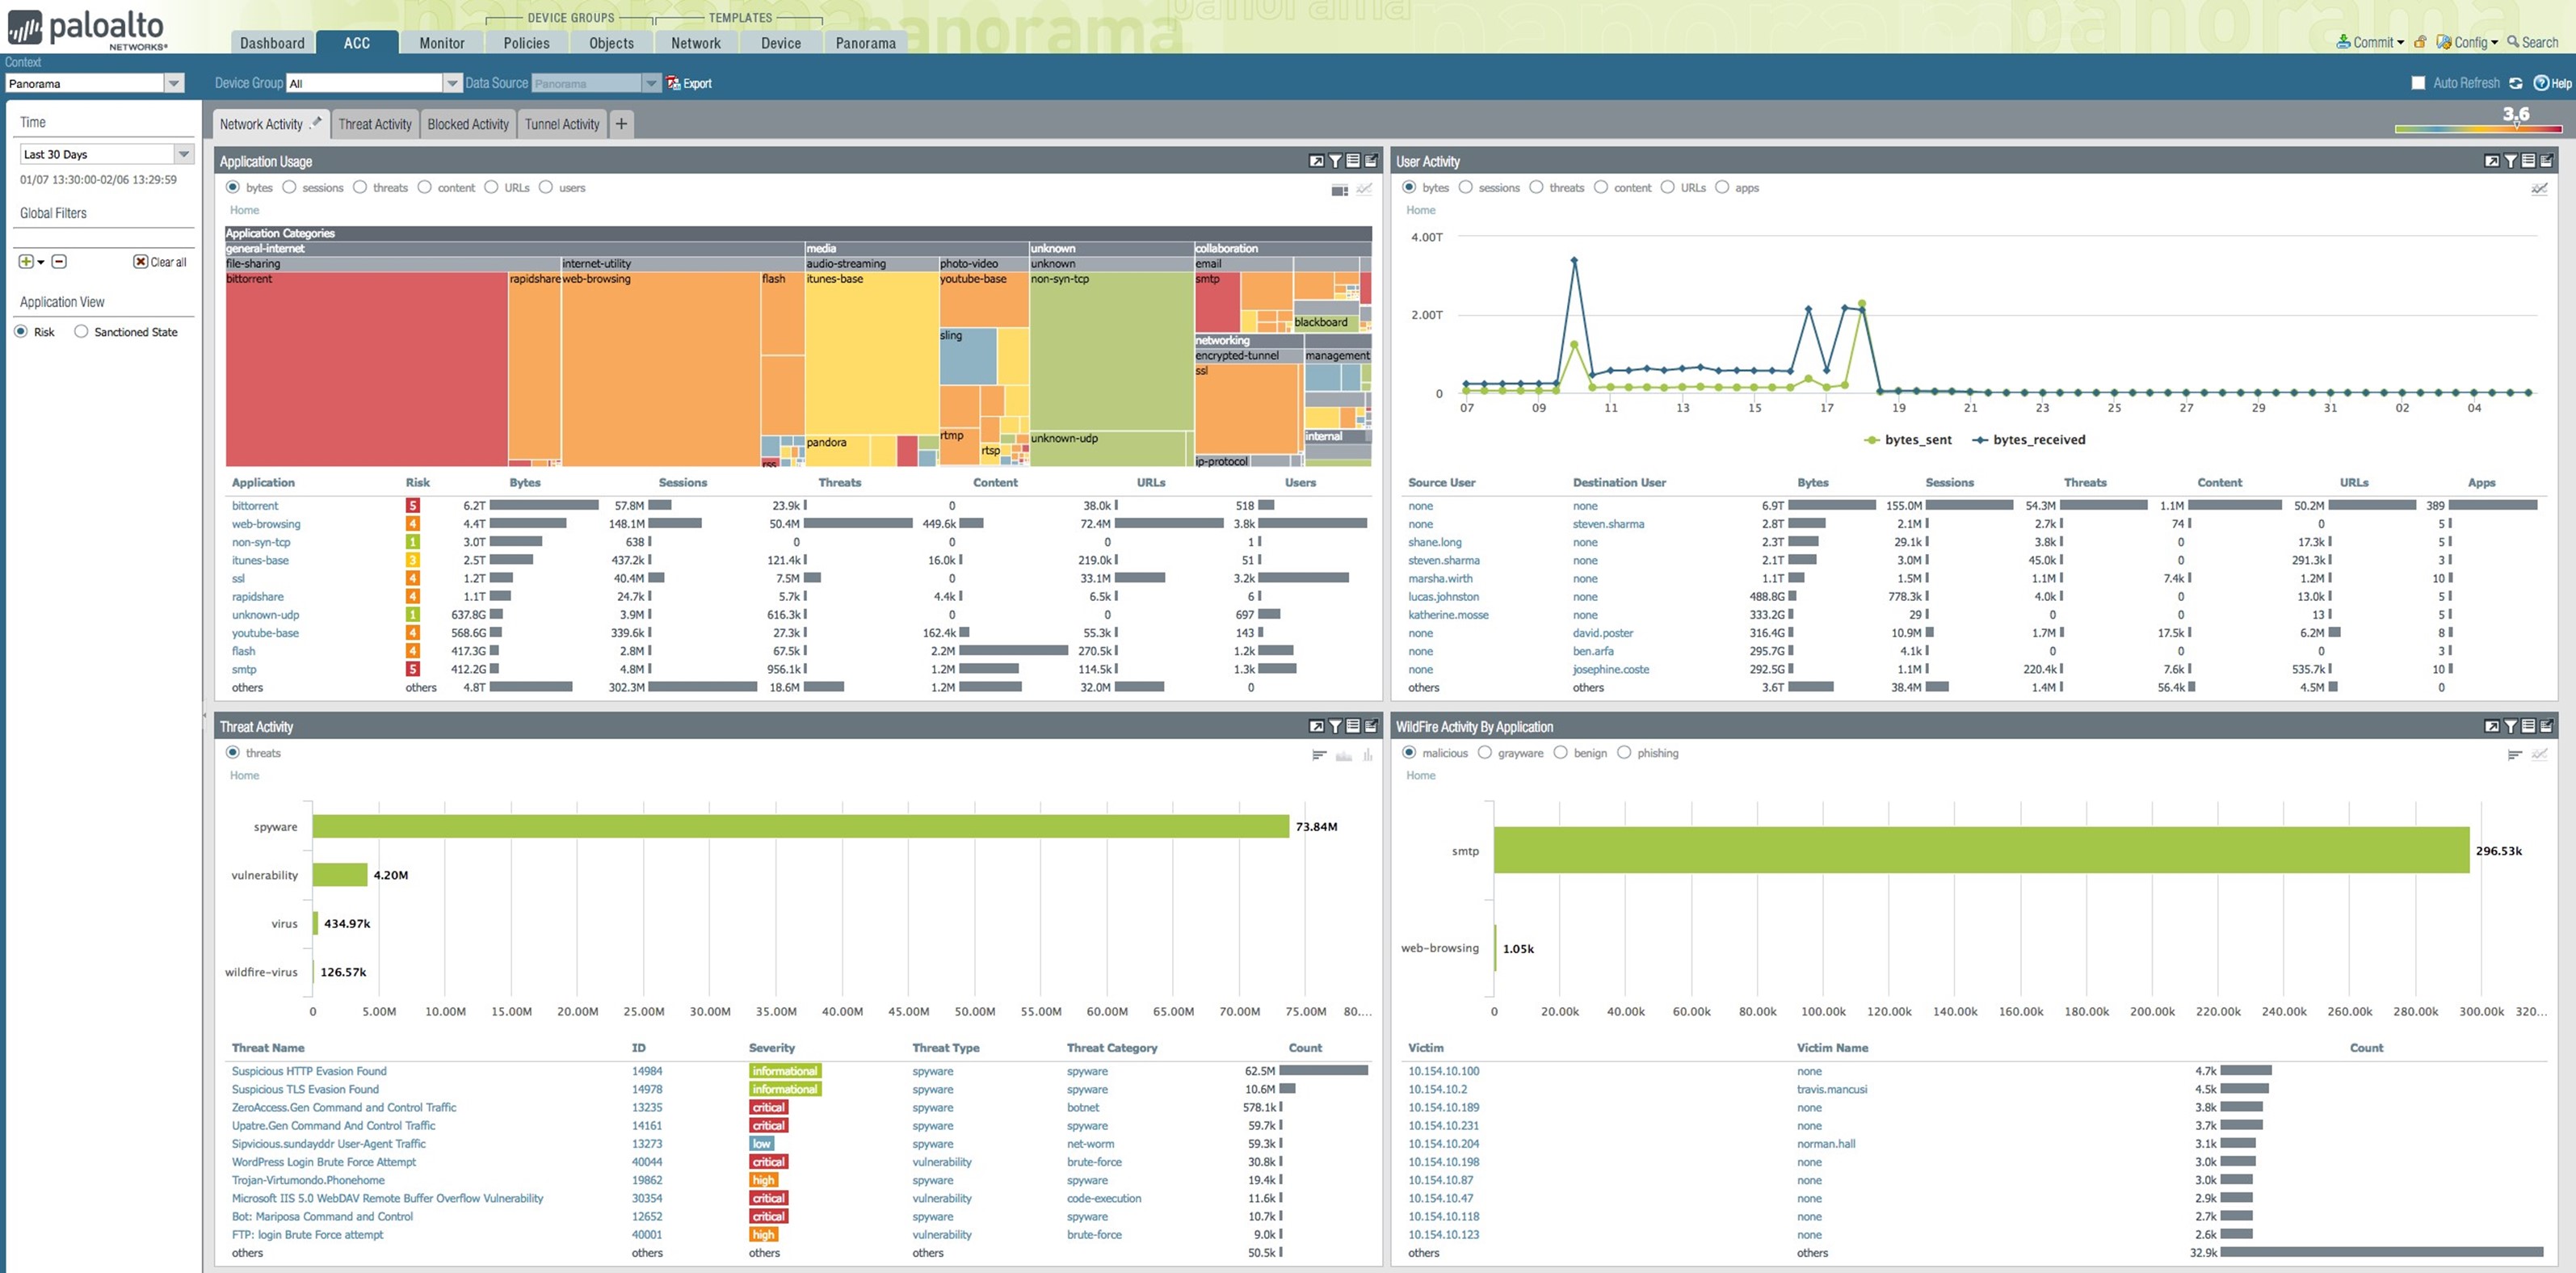
Figure 1: ACC – visual, interactive and customizable
The ACC: Answers to Your Security Questions
Visibility into your network and security posture is crucial in any network security environment. The Application Command Center presents a comprehensive view of all network activity, application usage, users and threats so you can get quick answers to important questions. Any valuable, actionable information must be visual, customizable, interactive and automated.
The next four sections explore how the ACC provides these key attributes in an easy-to-use format (see Figure 1). You can use the four out-of-the-box tabs for Network Activity, Threat Activity, Blocked Activity and Tunnel Activity, or create custom tabs for your specific needs. The use of widgets makes the user interface visual and user-friendly.
Visual – A Picture Is Worth a Thousand Data Points
ACC widgets provide a visual representation of data at the desired levels. You can choose different display options, such as tree, line or bar graphs, and the unit of measure, such as bytes, sessions, threats, content or URLs, by clicking the radio buttons on a widget. Figure 2 shows the application usage widget, which displays application traffic in bytes. Applications, represented as colored boxes, are grouped by application categories, indicated by gray bars. The size of a given box indicates the traffic volume for that application in the selected time frame.
The color of the box indicates the risk level of the application: red is critical, orange is moderate and blue is low-risk. The table below the graph shows additional information, such as the number of sessions, threats detected, and content or files included, as well as the URLs accessed by these applications. Users can obtain a complete view of what's happening in all applications on their network in one simple chart.
The widget in Figure 3 shows source and destination by region with a visual display of where traffic is originating and going, through interactive world maps.
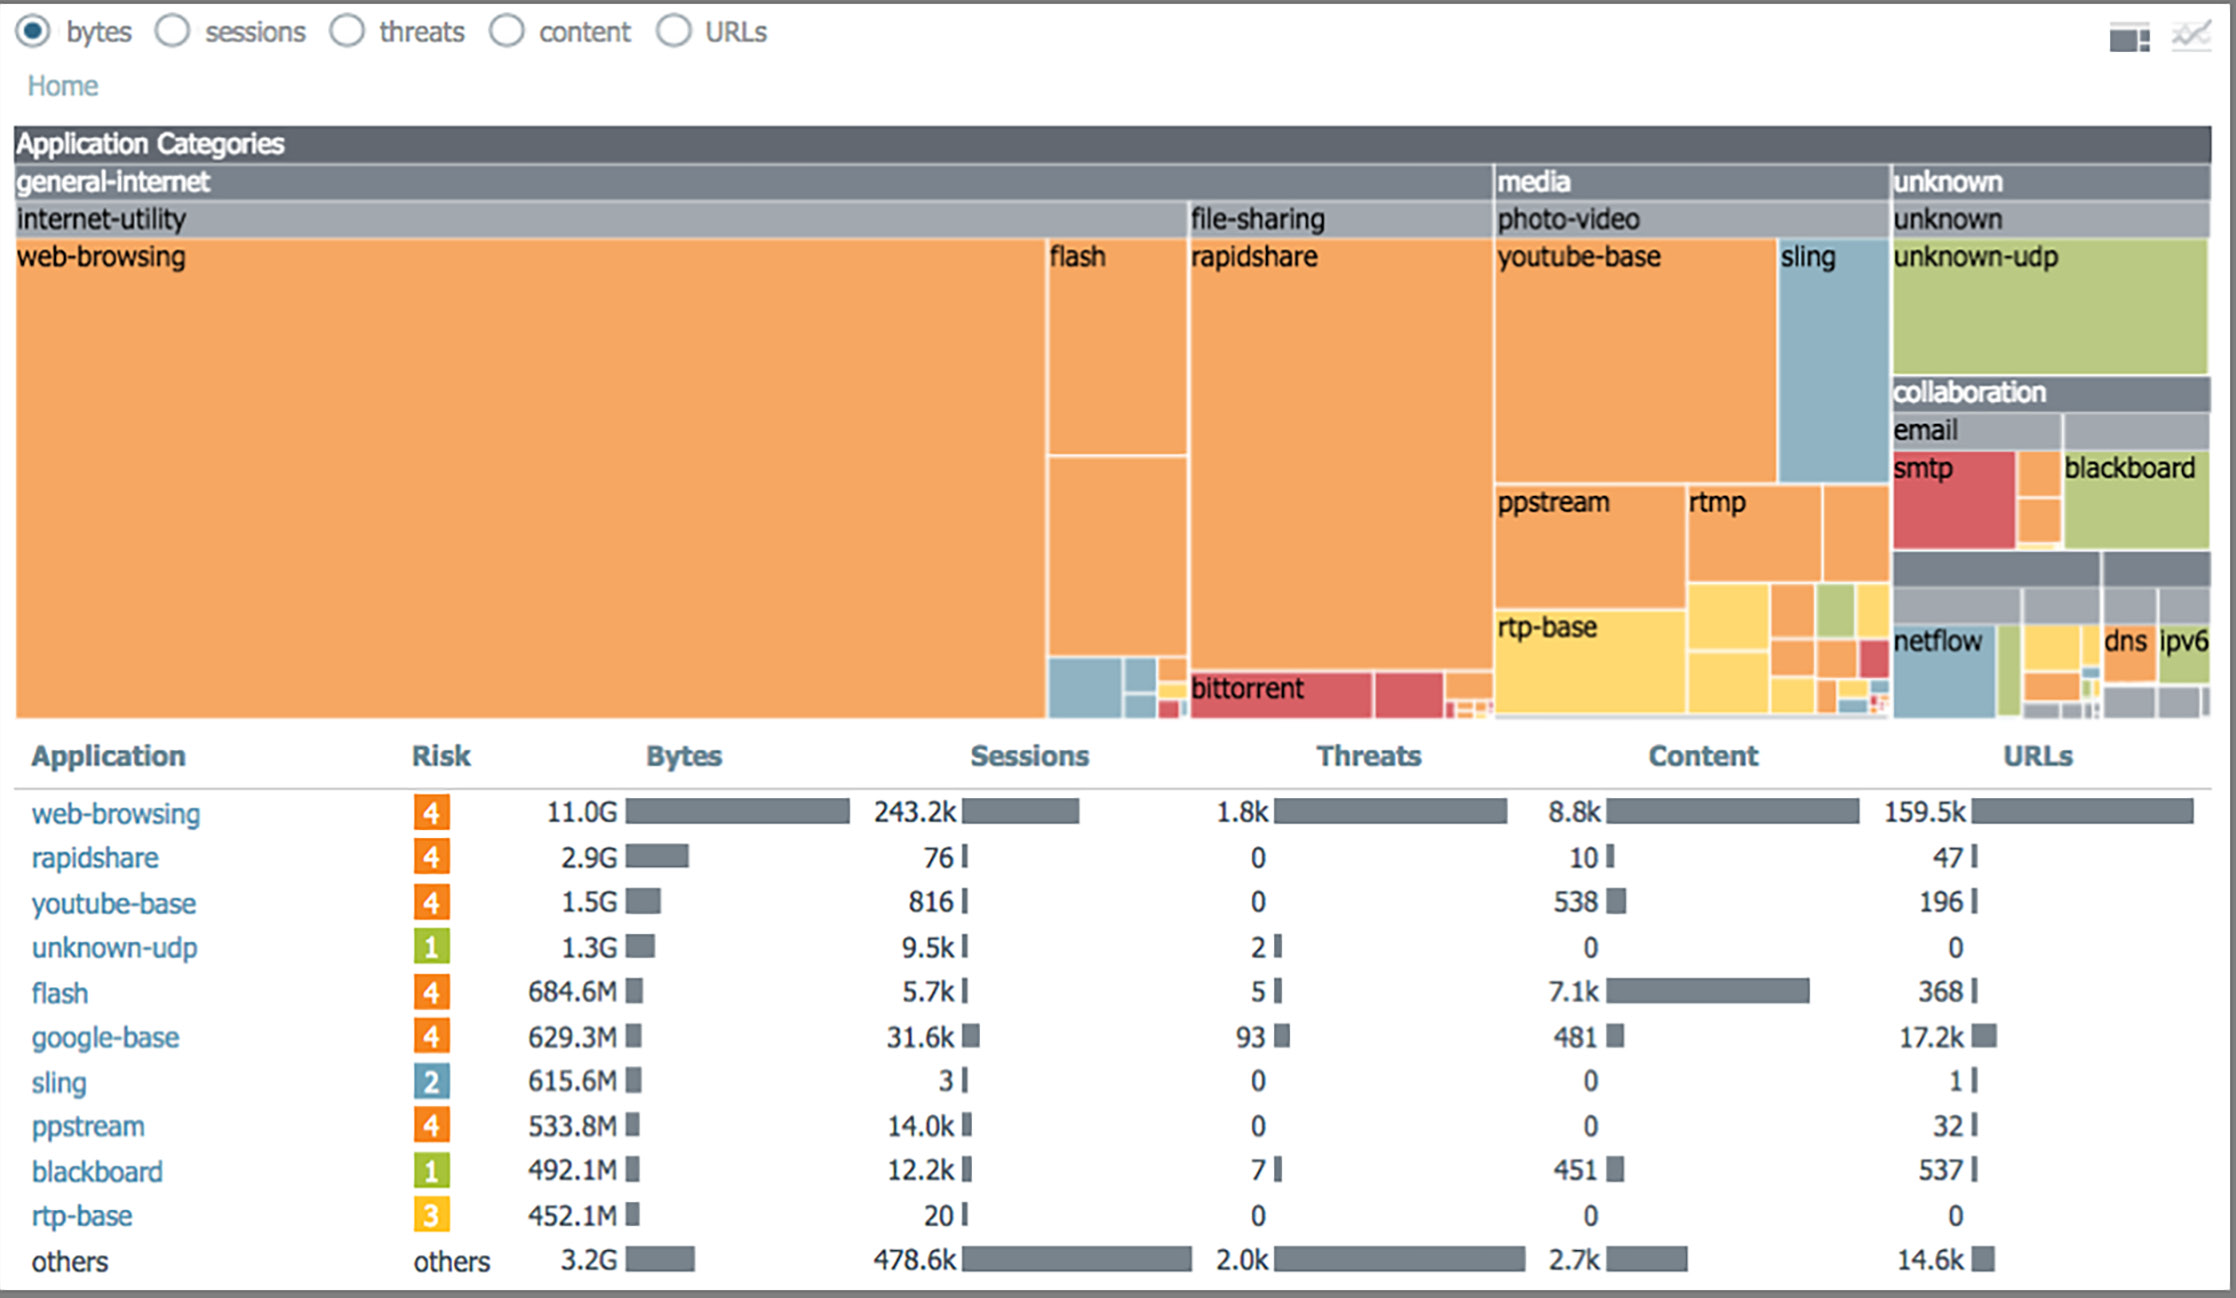
Figure 2: Application usage widget – application traffic by type, amount, risk and category

Figure 3: Geolocation – source and destination information for all application traffic
The widget in Figure 4 shows applications using nonstandard ports, most likely by hopping ports, which in turn demonstrates the power of Palo Alto Networks next-generation firewalls versus traditional port-based firewalls.
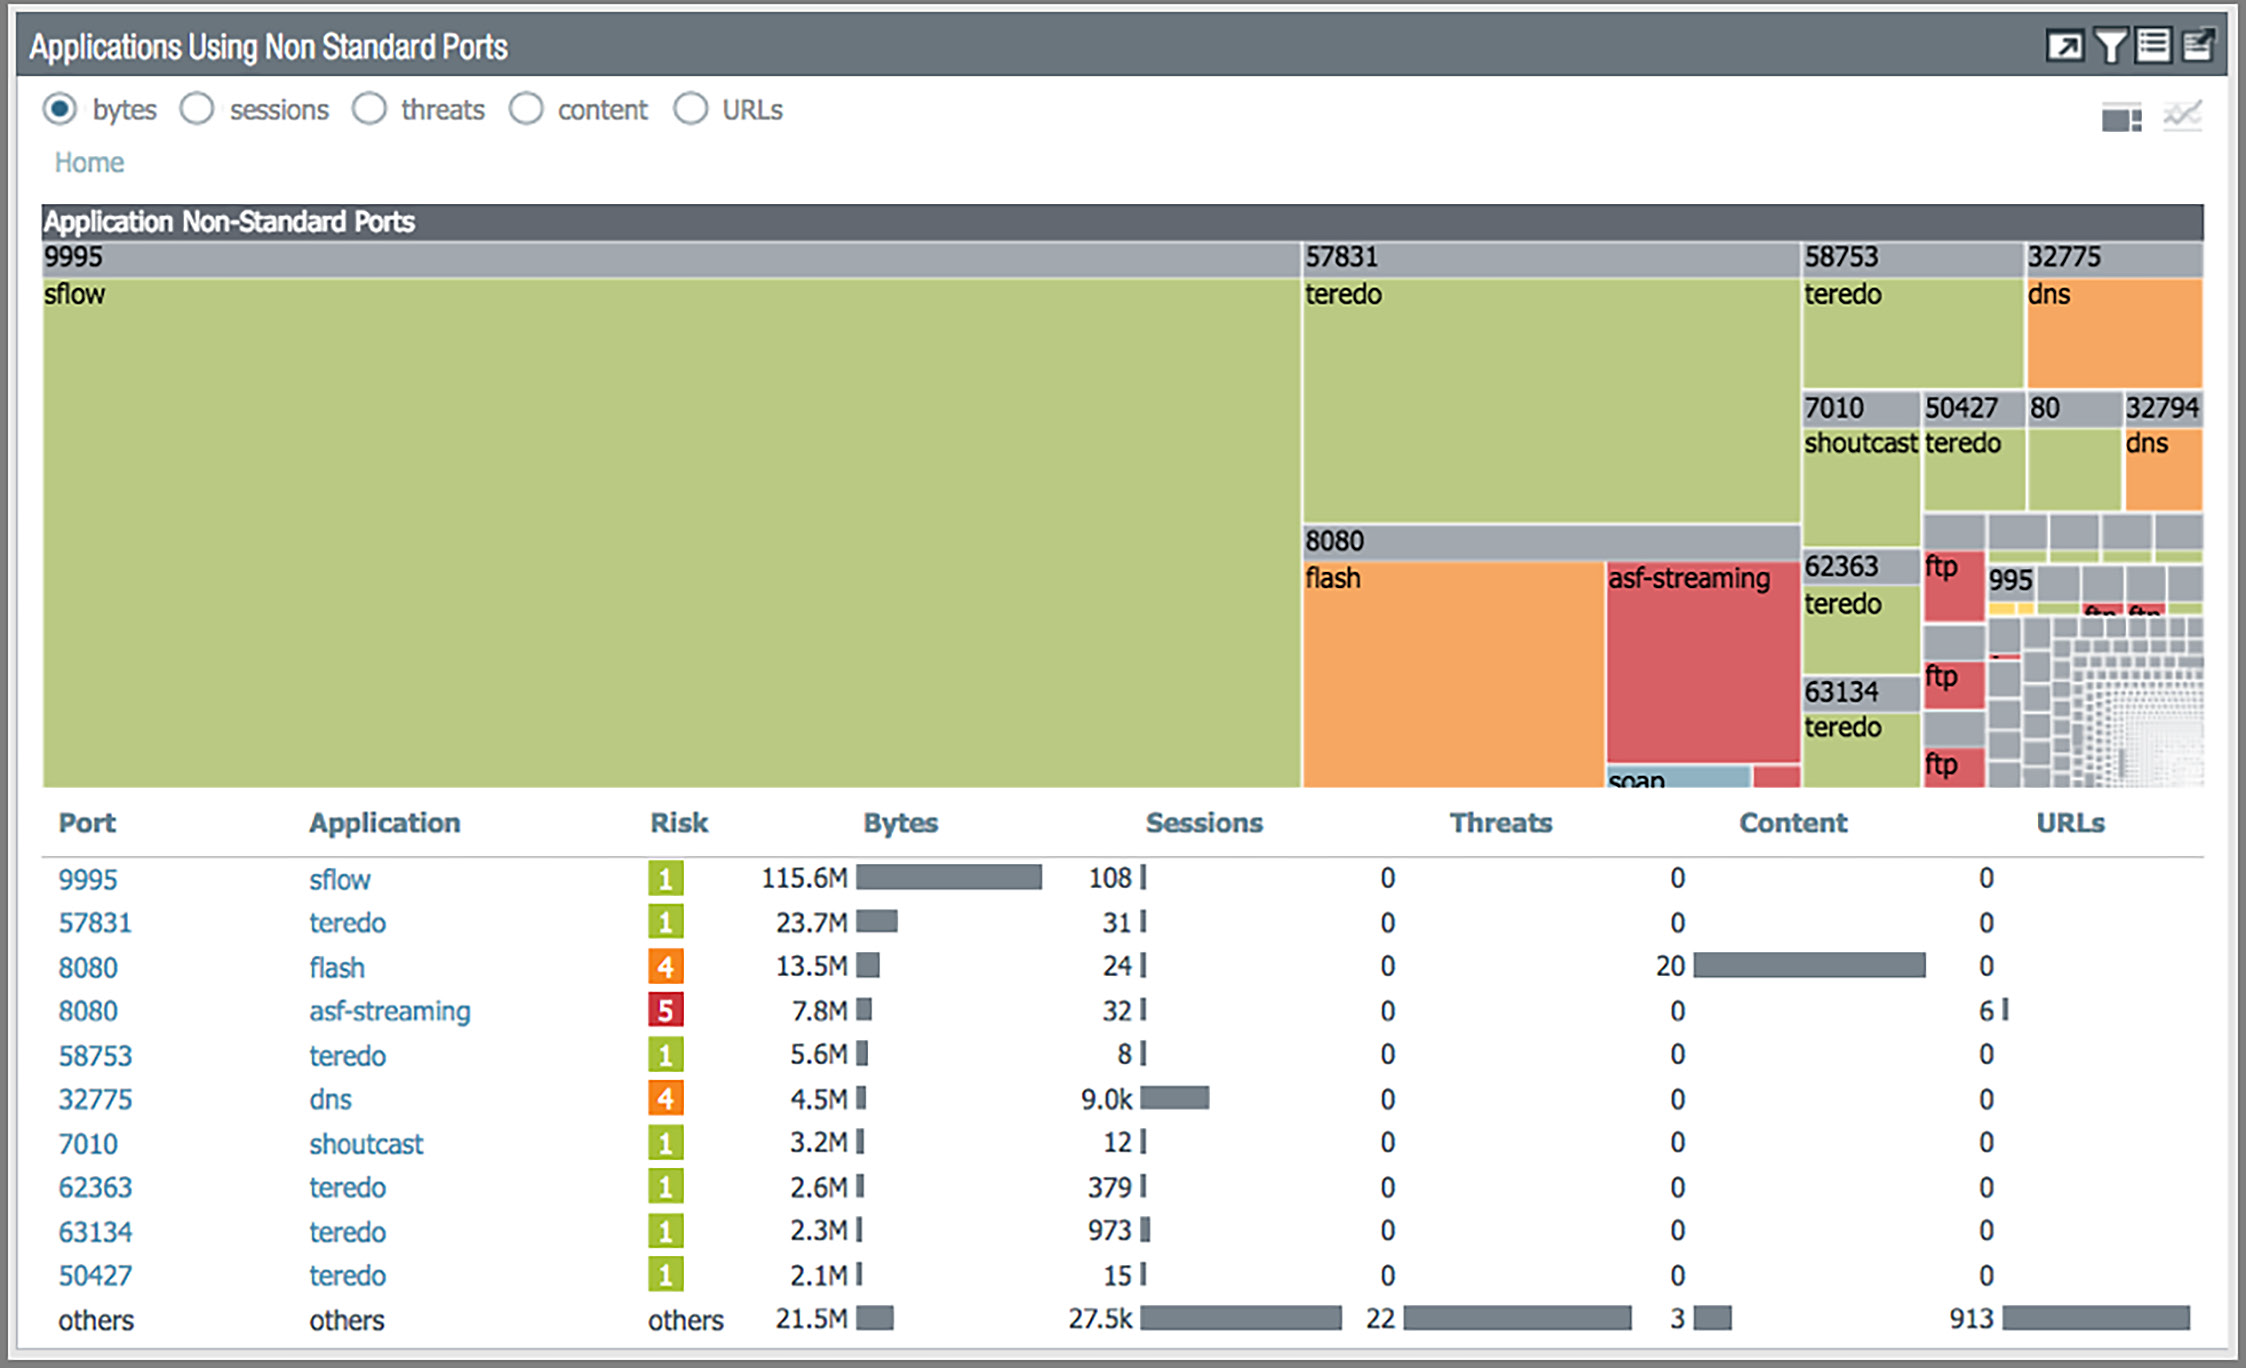
Figure 4: "Applications Using Non Standard Ports" widget
Customizable – One Size Just Doesn't Fit All
Every network administrator has different needs. The ACC lets every user customize the view by selecting available widgets from a drop-down list (see Figure 5). You can customize existing tabs and create custom tabs to monitor specific employees or multiple applications.
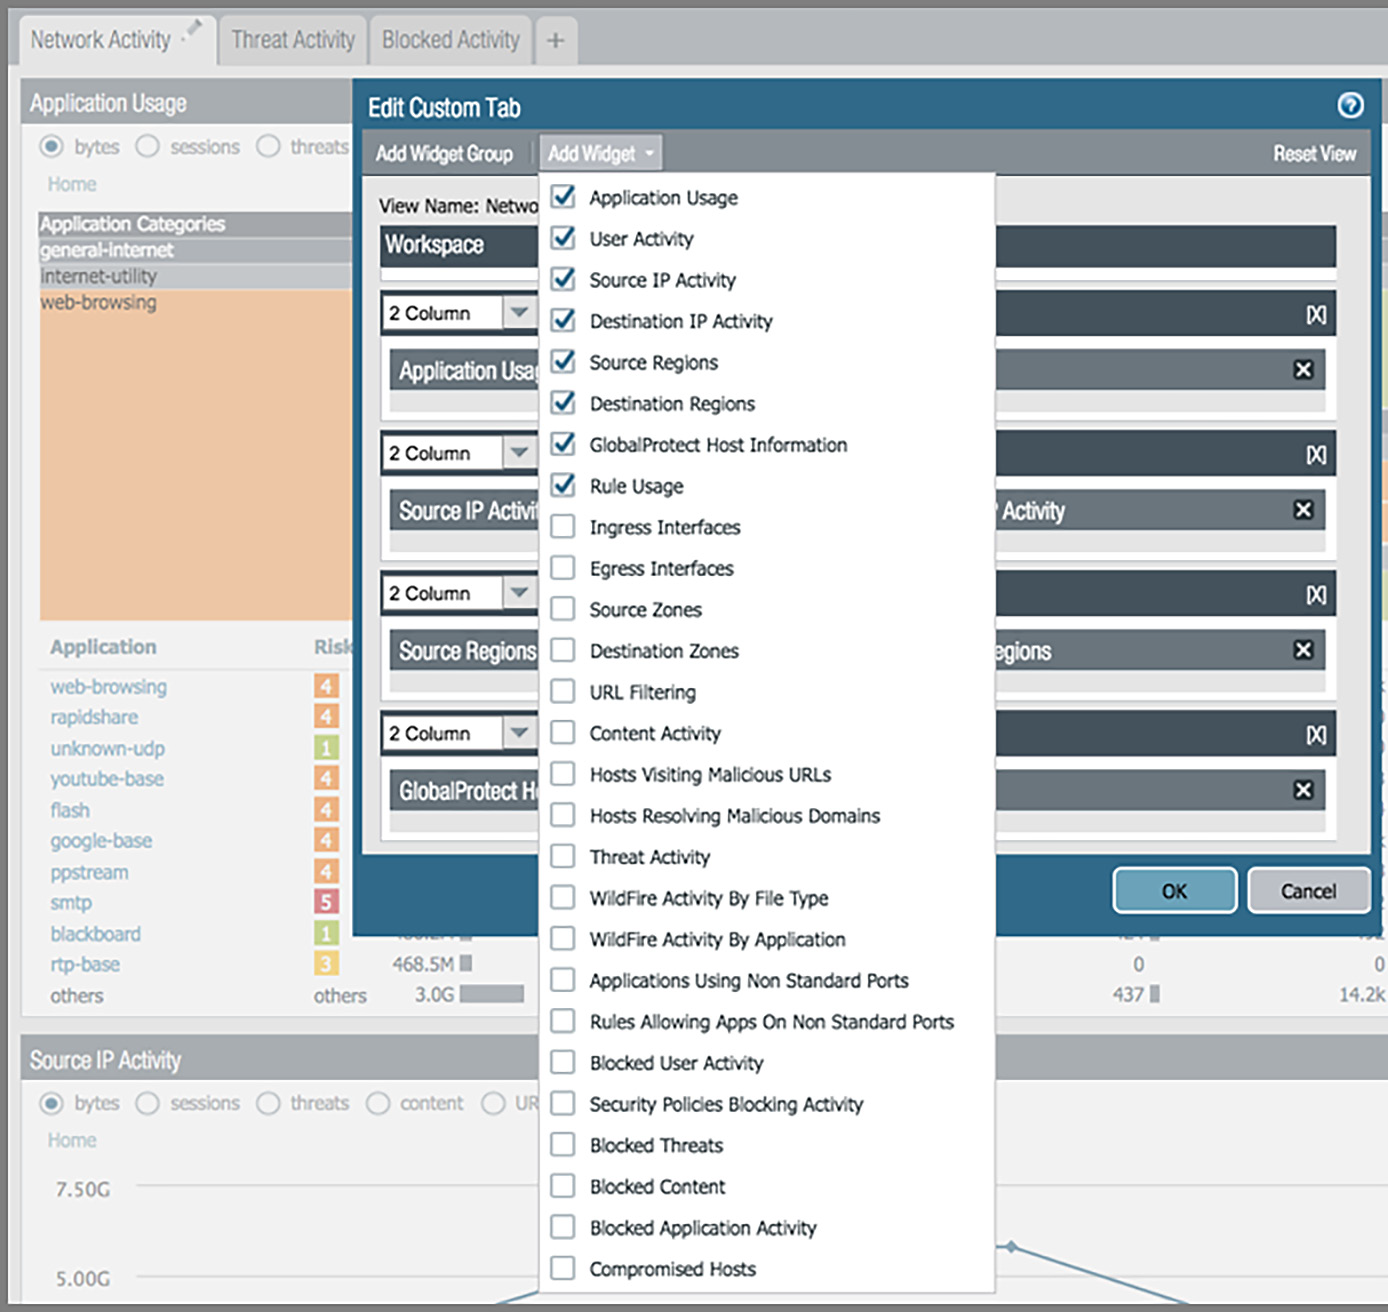
Figure 5: Widget customization
Interactive – Because You Need Answers, Fast
You can quickly find whatever answers you need by drilling down into the details from any part of the ACC. You can learn about applications, their risk levels (see Figure 6), or even a specific application or application group, just by clicking around. Interactive graphs offer valuable information in a single click, along with the ability to apply any item as a global filter across the entire UI.
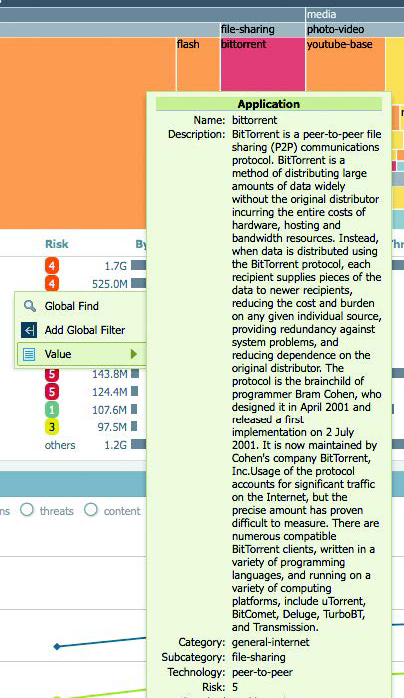
Figure 6: Detailed, interactive graphs
Automated – Do More With Less
In today's security environment, automation is essential to eliminate duplication, cut back on manual work, and reduce human error and oversight. The ACC has many powerful automation capabilities, but one of the most prominent is the Automated Correlation Engine (see Figure 7).
The Automated Correlation Engine is an analytics tool that reduces your data mining effort by identifying compromised hosts in your network. It automatically correlates isolated events across various logs, queries data for the specific patterns, and correlates network events to identify compromised hosts. The Automated Correlation Engine uses the correlation objects defined by the Palo Alto Networks Unit 42 threat research team to identify suspicious traffic patterns or sequences of events. Some correlation objects can even identify dynamic patterns observed in malware samples by Palo Alto Networks WildFire® cloudbased threat analysis service. These correlation objects trigger correlation events when a traffic pattern and network artifact matches that of a compromised host.
To help you quickly identify and respond to threats, correlation triggers are highlighted using different colors in the ACC.

Figure 7: Automated correlation of indicators of compromise
Customizable, Flexible Logging and Reporting
Logging and Monitoring
Log management is essential for any network security team. Logging all network activities in a logical, organized and easily accessible way ensures you can find the right information when you need it. Panorama can manage logs of individual Palo Alto Networks firewalls or subsets of multiple firewalls in your network.
Panorama provides a consolidated view of logs in various categories, such as traffic, threat, URL Filtering, WildFire submissions, data filtering and others. If you have a large network, you should consider distributing dedicated log collectors to increase your log storage capacity. WildFire Integration
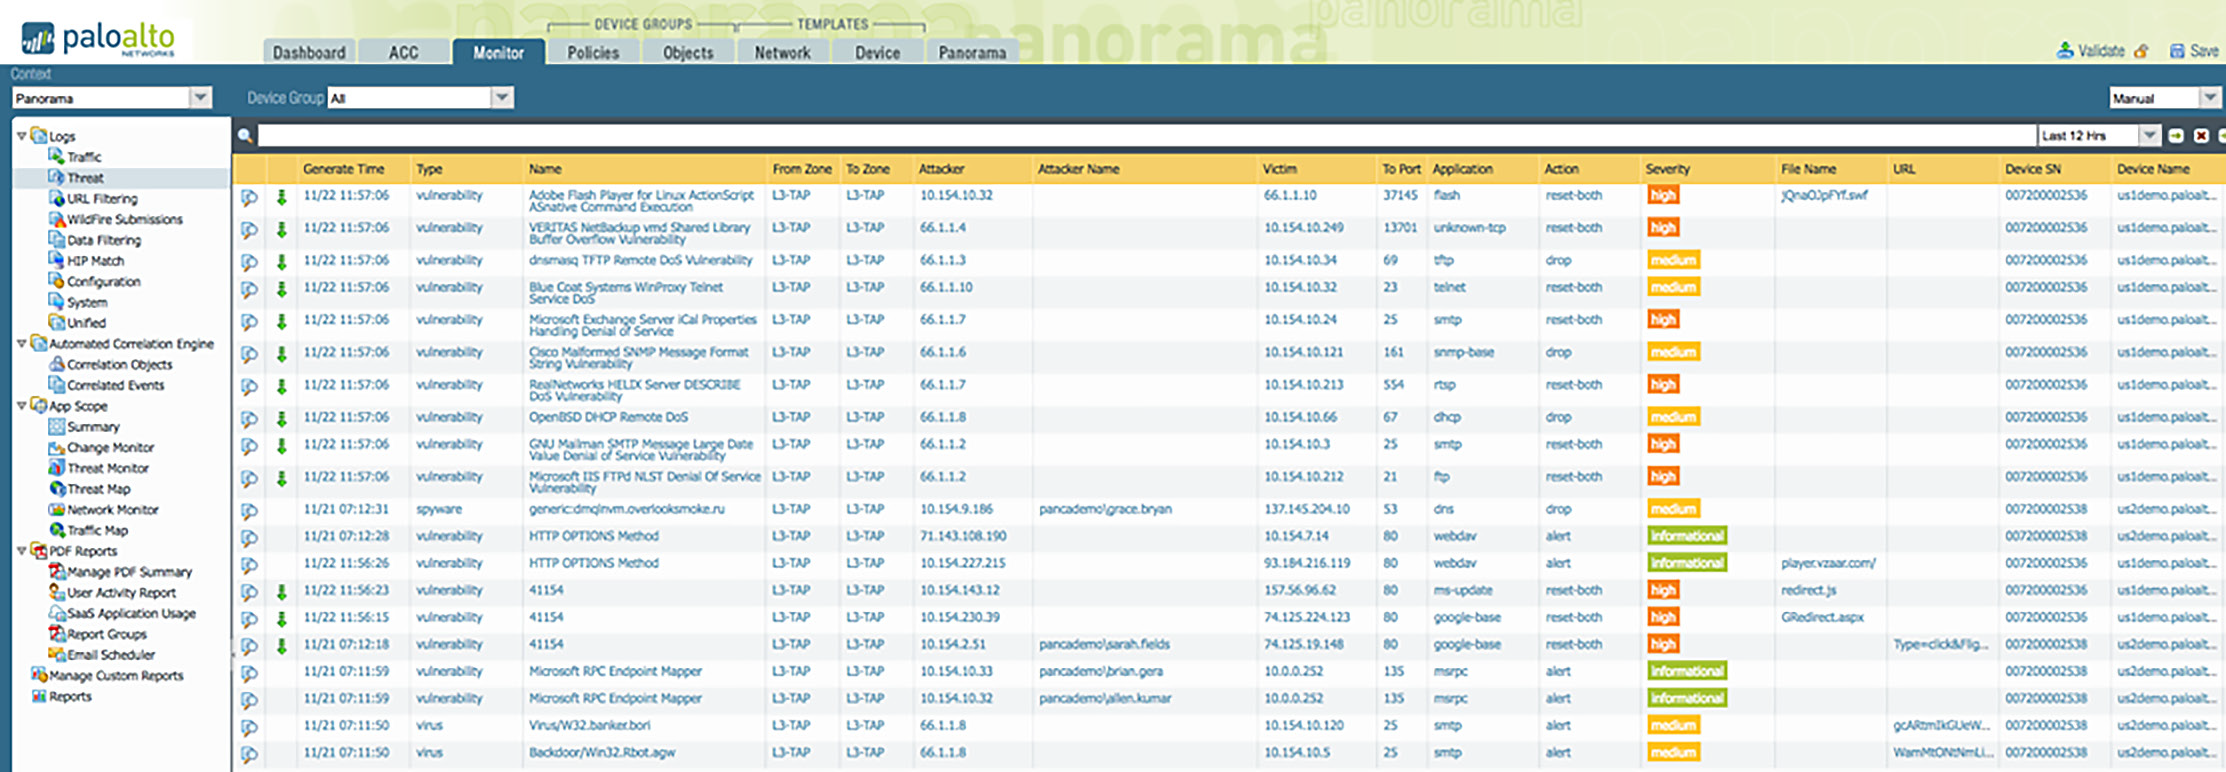
Figure 8: Detailed views into traffic, threats, URL filtering, WildFire, data filtering logs and more
In the Monitor tab, you can find WildFire submission logs, which contain malware analysis details of files submitted from firewalls. An administrator can go from a high-level view to a summary to details with a few clicks (see Figure 9). From here, an administrator can download the WildFire analysis details as a PDF or easily share it with other users.
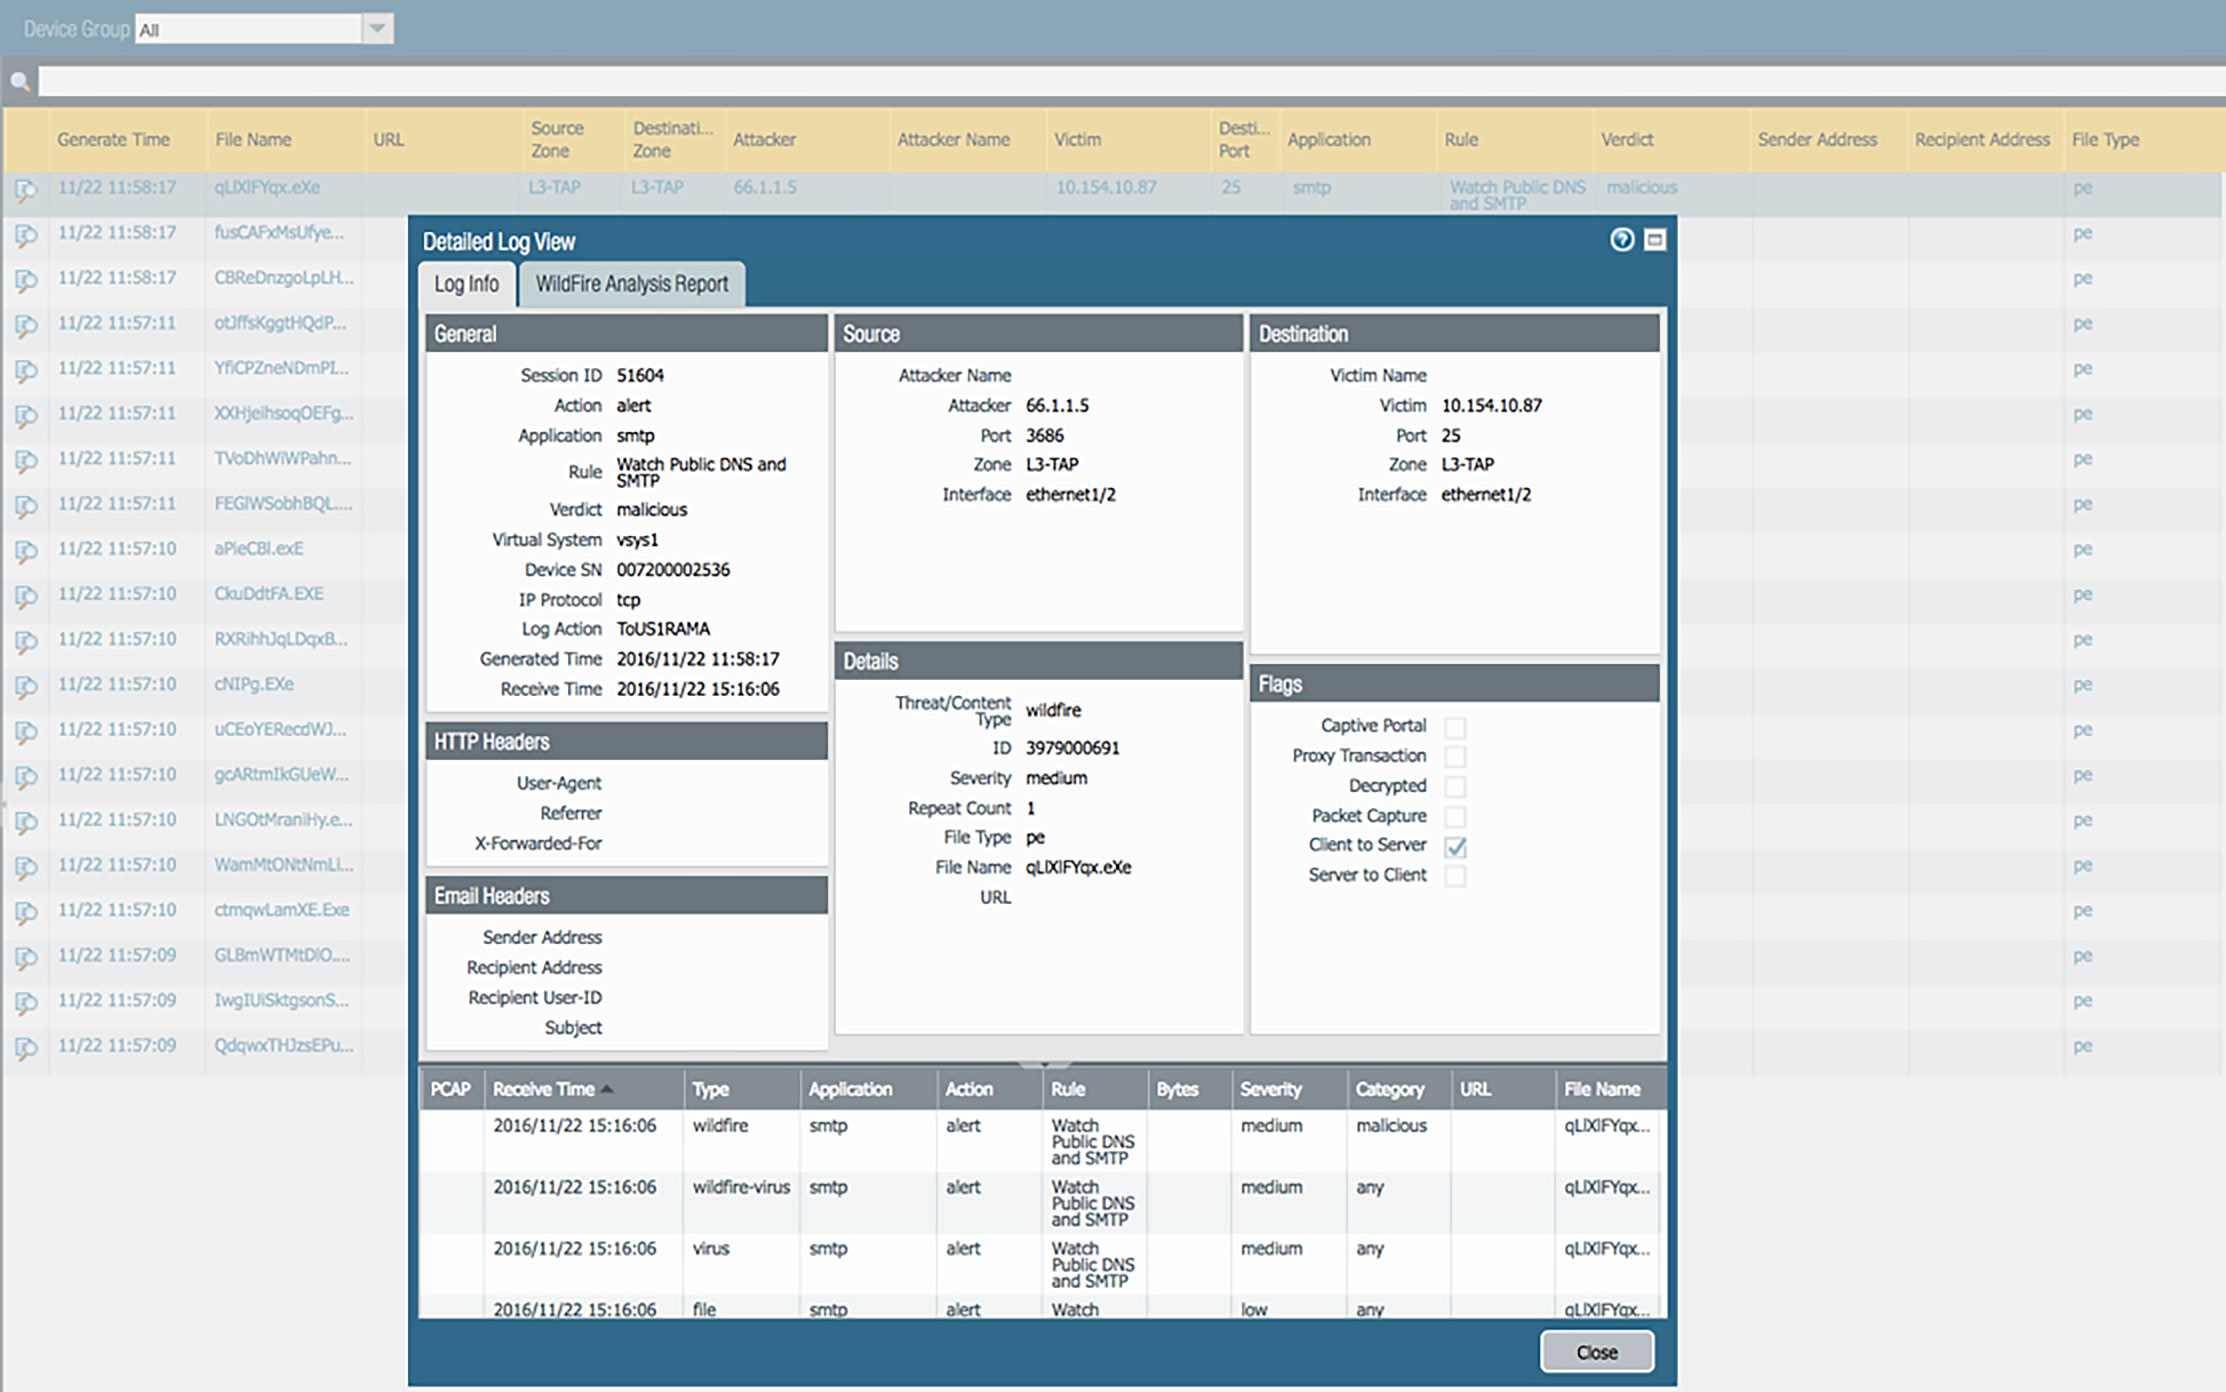
Figure 9: WildFire submissions log view
Maps, Trends and Integration With the ACC
Visual display of data, even logs, goes a long way toward making information more actionable. Therefore, our UI offers many map and trend charts to help you visualize the data. Each chart is interactive and can link the data directly to the ACC for a more detailed view. Figures 10–12 show some examples of log data visualization available in our user interface.
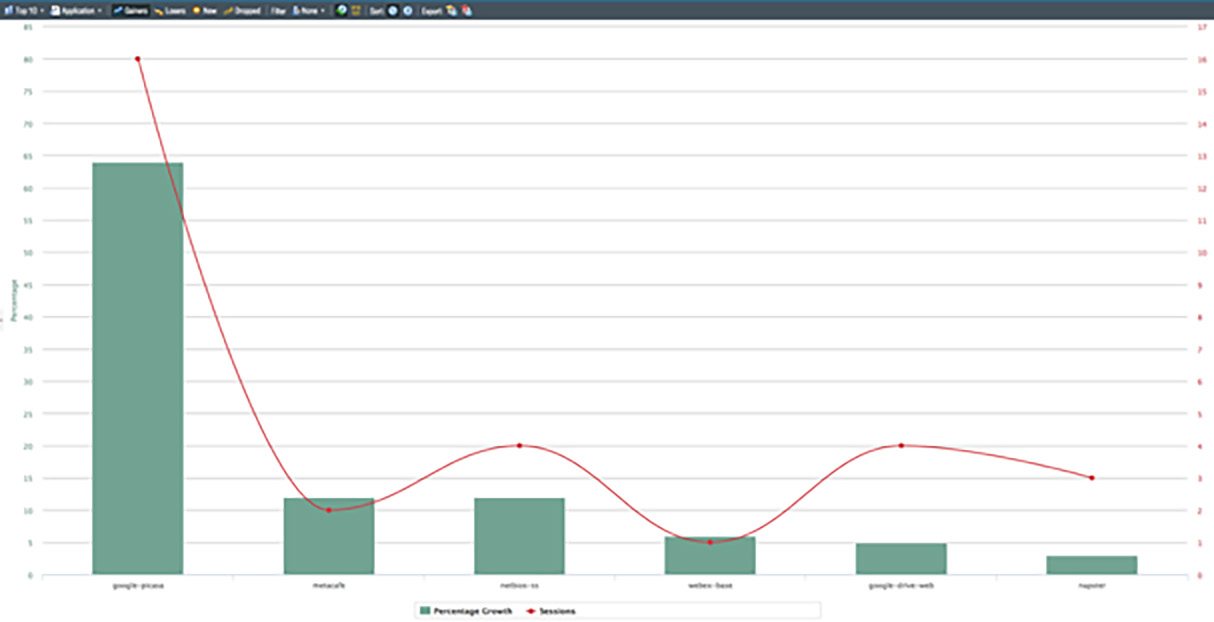
Figure 10: Application traffic over time

Figure 11: Insight into threat development over time
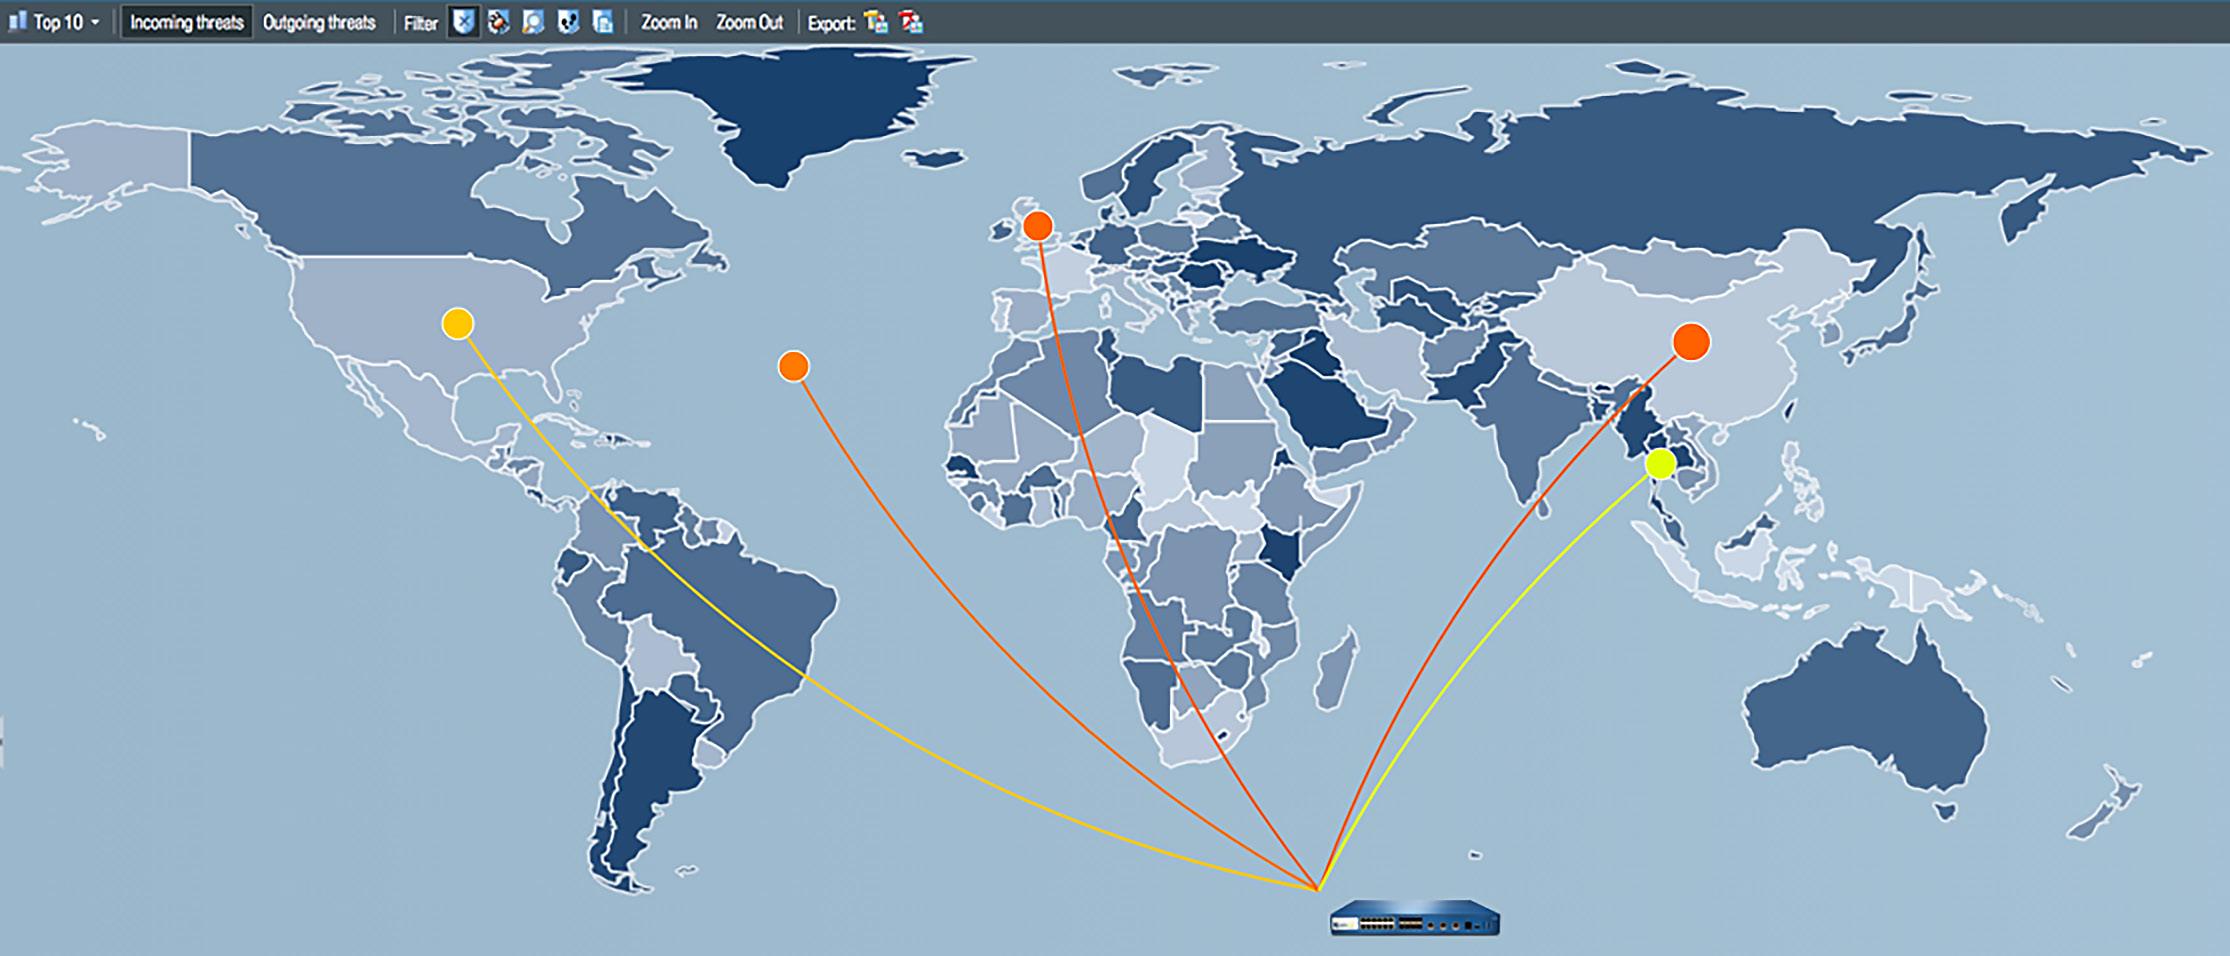
Figure 12: Interactive threat and traffic geolocation map
Figures 13 and 14 show how easy it is to develop a custom report or a user activity report. Reports can be saved in a report catalog run at a moment's notice.
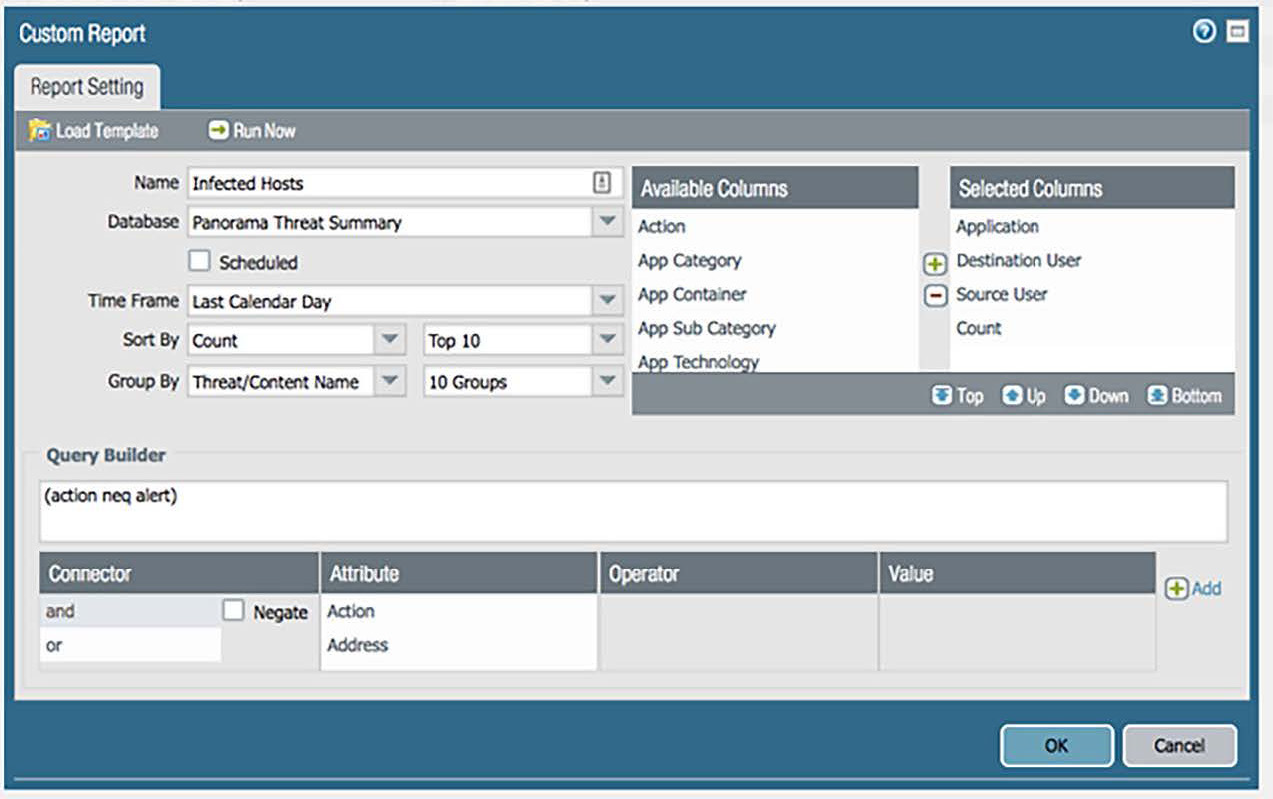
Figure 13: Easy-to-create custom reports
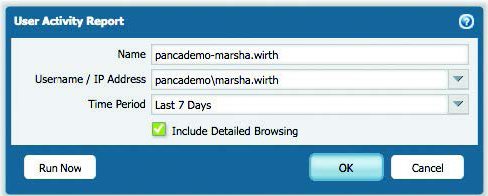
Figure 14: Customer user activity report
SaaS Usage Report
The appeal of SaaS applications, such as Microsoft® Office 365®, Box and Salesforce®, is growing, as is the volume of hidden threats in SaaS offerings, including accidental data exposure, malicious outsiders, promiscuous sharing and so on. Even sanctioned SaaS adoption can increase your risk of breaches and noncompliance.
A detailed, customizable SaaS application usage report (see Figure 15) provides insight into all SaaS traffic – sanctioned and unsanctioned – on your network. You can learn which users access which SaaS applications, how much data is being transferred to the cloud and where potential threats may reside. You can easily develop custom reports or user activity reports from the Monitor tab, as well as schedule and share them, or save them in a report catalog to be executed later.

Figure 15: SaaS application usage report
Central Visibility for Multiple Next-Generation Firewalls
Comprehensive Insight
In today's distributed environments, it's increasingly important to have central visibility into all network and threat activities. Being able to see traffic across all firewalls from one central location keeps you efficient and provides additional security through a comprehensive view of correlated data from several firewalls. Figure 16 shows how you can view traffic for your entire network, select firewalls or device groups.
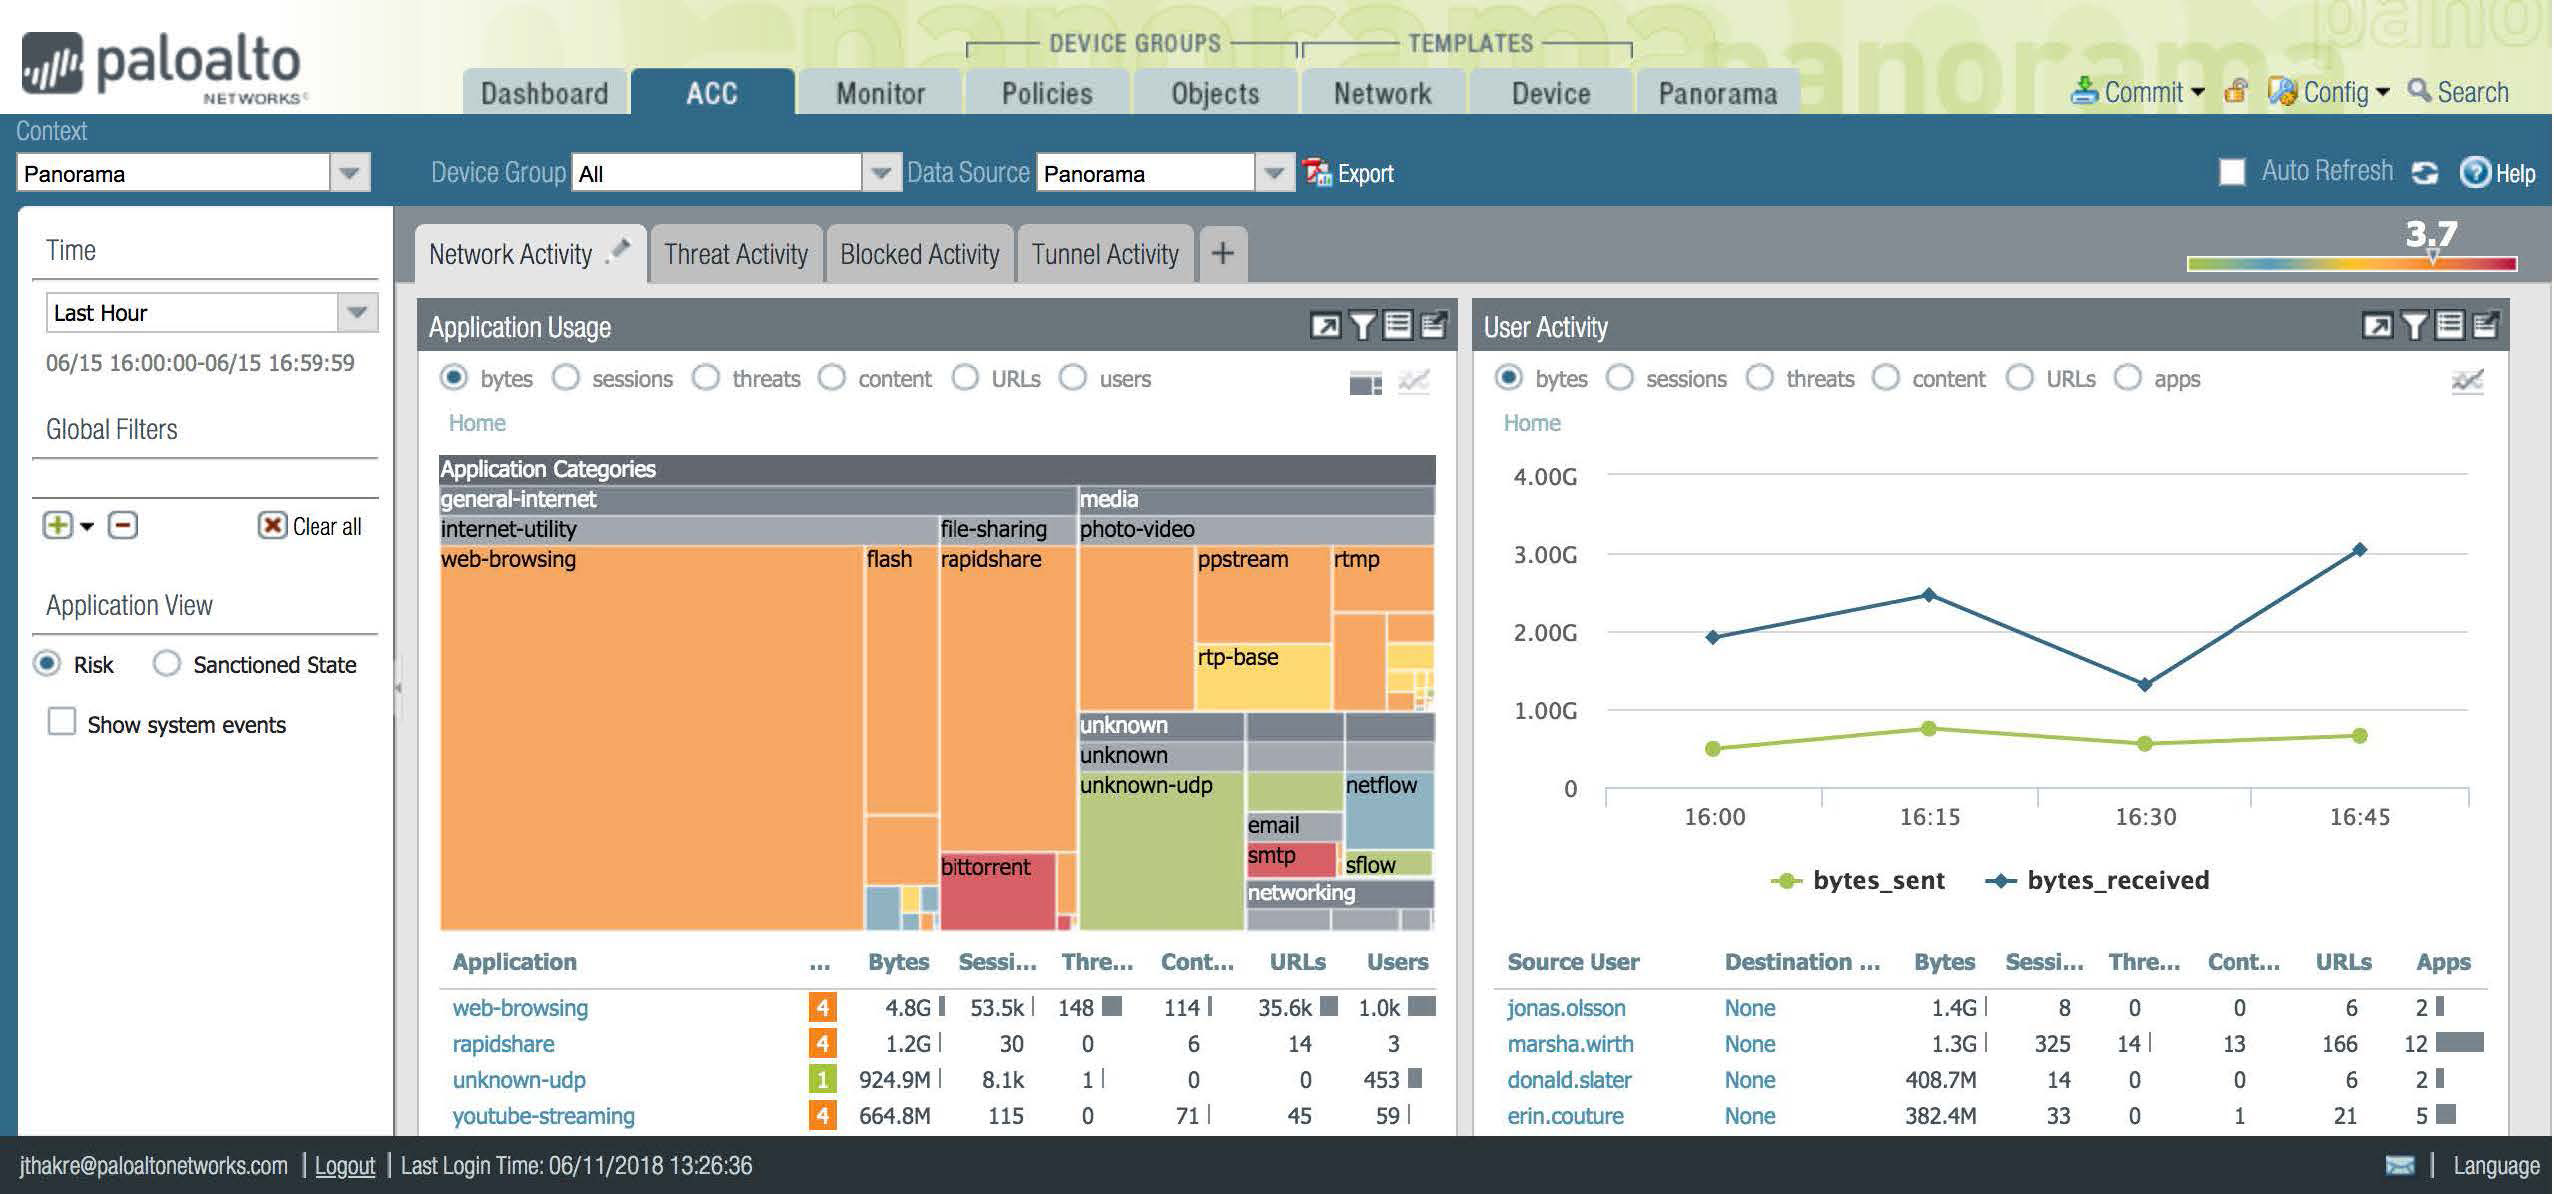
Figure 16: Management for your entire network of NGFWs and any device group
Multi-Tenancy and Localized Control
Managed security service providers and large enterprises need multi-tenancy. Using Panorama, you can set up your security network so that local administrators can only see and control traffic for their specific device groups without affecting others. In other words, you can configure groups and administrator rights such that each group can function as its own company while the Panorama administrator maintains central management and control.
Conclusion
Visibility, customization, ease of interaction and automation are the key requirements to make data manageable and actionable. Palo Alto Networks next-generation firewalls and management products go above and beyond these requirements.
The Application Command Center analyzes firewall data and displays it in a visual, interactive format. Individual administrators can have custom dashboards to fit their individual needs while extensive drill-down, filter and search capabilities help security professionals answer crucial questions and respond quickly. Automated threat correlation across firewall events creates an additional layer of security and saves time.
Logging with Palo Alto Networks goes beyond processing and listing events in a traditional manner. You can view logs in a way that makes sense – as graphs, maps, trend charts and more – to help you interpret the network data. You can use standard reports or create custom ones to render the data the way you need it. The Automated Correlation Engine eliminates manual correlation tasks and surfaces threats that would otherwise go unnoticed because of the noise. Whether managing a single next-generation firewall or an entire network, Palo Alto Networks makes it easy to visualize and interact with the data.