Risk Analysis and Incident Response
As an IT professional, you have many options at your disposal for countering security threats and protecting information assets. You can block network traffic at firewalls, monitor variations in system activity patterns with intrusion protection systems (IPSs), filter content for malware and offensive material, encrypt information during transmission, and limit access to applications and services. With so many options, how can you choose? Should you implement them all? Even if you had the budget and resources to deploy and manage all the countermeasures available would you want to? How do you know when you are "secure enough?" One way to answer that question is to use risk analysis, the first topic of this chapter.
Risk analysis helps identify priorities and determine the appropriate level of investment for particular assets. The objective of a risk analysis is to determine business risks and countermeasures that should be deployed to mitigate those risks; it cannot, however, guarantee that threats will not be realized. The second section of this chapter will examine examples of monitoring techniques to help prevent information theft.
Even in organizations with well-formulated risk analysis studies, professionally implemented countermeasures and monitoring programs, security incidents can still occur. When that happens, it is essential that the organization respond in such a way to minimize the damage, expedite the recovery, and learn as much as possible from the incident to prevent future damage. Incident response planning is discussed in the third section of this chapter.
Risk Analysis: Determining Appropriate Levels of Protection
Risk analysis is a technique for conducting a cost/benefit analysis on information assets. The goal is to determine how much should be spent to prevent information theft and other threats.
As the primary concern in this guide is to prevent information theft, it will not address all threats and vulnerabilities that a comprehensive IT risk analysis should cover. For example, natural disasters, the disruption of civil services, or other threats that a business continuity plan would likely take into account won't be explored. The basic principles described here would, however, apply to those situations as well.
In an ideal world, an organization would not spend more than an asset is worth. An asset deemed to be worth $25,000 annually should not cost $40,000 per year to protect. But there is more to risk analysis than the obvious. For example, if one were to spend $10,000 per year protecting that $25,000 asset, what should it be spent on? There are many options including:
- Network safeguards, such as firewalls and IPSs
- Encryption mechanisms
- Authentication and authorization mechanisms
- Monitoring systems
The safeguards deployed must be based on the threats faced by the asset. The risk analysis process can be broken into several steps:
- Identifying threats to information assets
- Assessing the value of information assets
- Performing quantitative analysis
- Selecting protection mechanisms
The results of a risk analysis are most useful when the scope of the analysis includes business as well as technical objectives. This will influence how the first step is conducted.
Identifying Threats to Information Assets
The first question to ask when conducting a risk analysis to prevent information theft is, "What can happen to our information?" The list of answers is long and the range of topics is broad, including:
- A virus can infect a server that stores data and can corrupt the files
- A Trojan horse can copy sensitive and personally identifying information and transmit it to an attacker's FTP site
- A staff programmer can leave a backdoor in an application to steal or destroy information
- An employee can lose a laptop with design specifications for a new line of products
- An eavesdropping attacker can capture network traffic as an executive reads her emails using an unencrypted public wireless network
- A DoS attack can make key databases and applications inaccessible to customers and business partners
The list could certainly be longer but is sufficient to demonstrate the scope of the problem faced by a team assigned to conduct a risk analysis.
Categories of Information Theft Threats
Rather than work directly with long lists of specific threats, it is often easier to aggregate the set of threats into several categories based on similarity of attack technique and similarity of countermeasure. One set of categories related to information theft:
- Malware, including viruses, worms, Trojan horse, keyloggers, video frame grabbers, and spyware
- Insecure applications, including software with known vulnerabilities, poorly designed applications, and programs with backdoors
- Information theft during transmission and use outside of managed networks
- Theft of hardware
- Disruption of service
It is easier to work with categories because once they have been identified we must determine the likelihood of those threats being realized. This can be done in a number of ways.
Likelihood of Experiencing Attacks with Particular Threats
The methods used to asses the likelihood of an attack by a particular type of threat include:
- Individual experience
- Collective experience
- Consensus of opinion
Each of these techniques has advantages and disadvantages. Using all three methods is suggested.
Individual Experience
Historical information is a good starting point for assessing the likelihood of threats. If an organization has been subjected to six virus incidents in the past month, that is a good indication that the threat level from malware is high. If the same company has never experienced a DoS attack, that is also a fact to take into account. The past experience of an organization should be part of the risk analysis assessment, but general trends in information security should be taken into account as well.
Collective Experience
Like a stock prospectus that includes phrases such as "past performance is not a guarantee of future performance," the limits of historical patterns should be understood. Threats to information theft are constantly changing; email macro viruses were a problem at one time, but now Trojan horses and spyware are more of a problem. The volume of threats can also change. Consider the number of vulnerabilities reported by US-CERT since 2000 (see Table 7.1).
| Year | Number of Vulnerabilities Reported |
| 2000 | 1090 |
| 2001 | 2437 |
| 2002 | 4129 |
| 2003 | 3784 |
| 2004 | 3780 |
| 2005 | 5990 |
| Average | 3535 |
Table 7.1: Vulnerabilities reported to US-CERT between 2000 and 2005 (Source: CERT/CC Statistics 19862006, http://www.cert.org/stats).
As Table 7.1 shows, the number of vulnerabilities reported jumped significantly after 2001 and again in 2005. Another significant increase is likely for 2006; according to US-CERT, there were 3997 vulnerabilities reported in just the first 6 months of 2006.
You can argue about what these jumps indicate. Clearly, more vulnerabilities are being reported, but that could be the result of greater awareness of vulnerabilities and more willingness to report them, more vulnerability testing on the part of vendors and IT customers, or there is simply more complex software in use. There could also be varying opinions about the value of a simple metric such as the number of vulnerabilities in a particular program. For example, Microsoft Internet Explorer (IE) is a much more feature-rich product than it was several years ago; if newer versions have more vulnerabilities, can you argue that the benefits of the additional functionality outweigh the associated risks?
Use statistics about information security carefully. Understand the methodological limitations of surveys and other sources of information. Some data may be based on self-reporting and not reflect the population at large, some may be biased to one type or size of an organization, and others may use ambiguous categories (for example, should a keylogger be considered a Trojan horse or spyware?).
Even with the inherent limitations of surveys, they can provide a broad-brush overview of the state of threats and the actions taken by other organizations.
Consensus of Opinion
Another method for assessing the likelihood of experiencing particular threats is to gather the opinions of informed security professionals. This technique is known as the Delphi method, after the ancient Greek oracle of Delphi, famed for giving divine, but often cryptic, advice to mortals. The advantage of the Delphi method over historical measures is that the former technique is more likely to take into account current trends. For example, today there might be a greater trend toward application-specific attacks motivated by economic gain than there has been in the past. If so, countermeasures should be in place to combat this. Historical measures would not reflect this emerging trend.
A significant disadvantage of the Delphi method is that it can be biased by personal experience or insufficient evidence. For example, when variations of the Zotob worm struck in 2005, several media organizations reported it as a significant attack. In fact, it was not particularly widespread relative to some other well-known attacks but had successfully infected the systems of a number of news organizations.
Another limitation of both historical measures and the Delphi method is that people are often most interested in emerging threats and it is difficult to gauge whether these threats will amount to much. A relatively new term in the information security lexicon is ransomware. The purpose of this type of malware is to encrypt a victim's critical data using strong encryption to offer the decryption key only in exchange for payment. Will this type of threat become more popular among attackers? It is difficult to say; certainly economically motivated attacks are likely to continue, but how this particular threat will evolve is not clear.
Although the specifics of which threats present the greatest danger to a particular organization will be answered in the course of the risk analysis, it is clear that information assets are subject to multiple threats as shown in Figure 7.1.
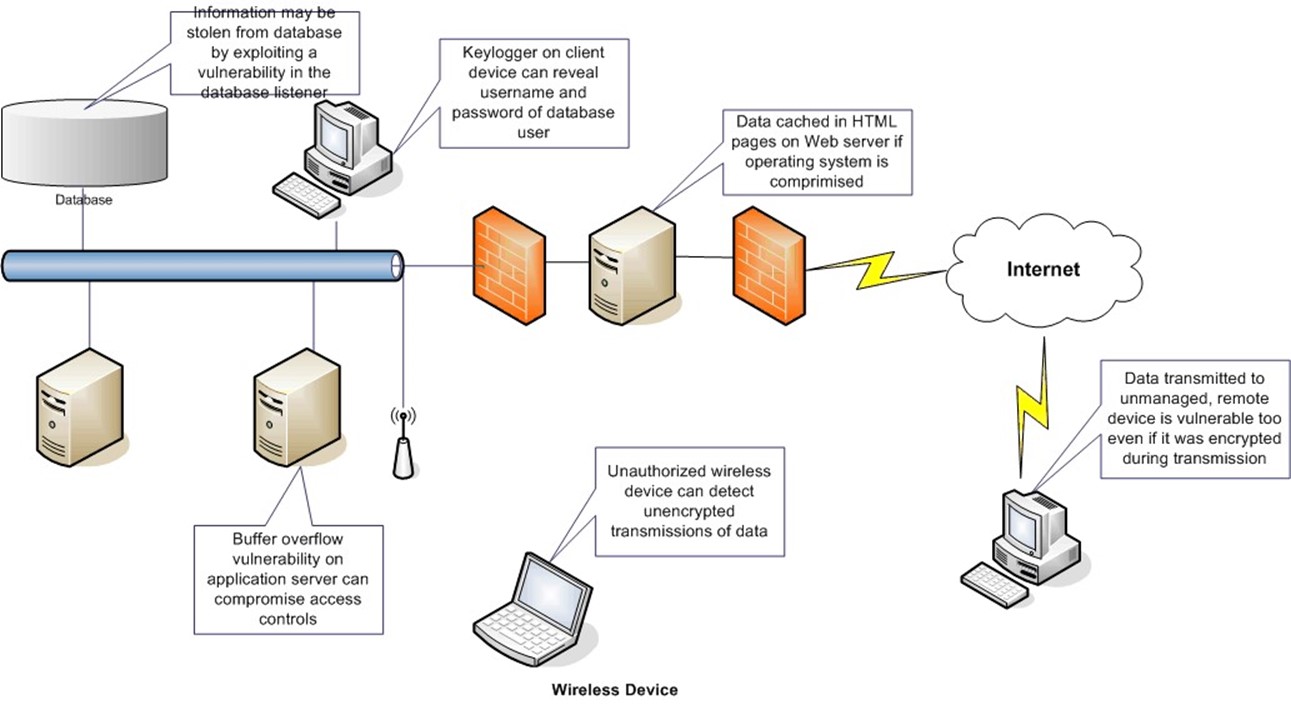
Figure 7.1: The same asset, such as information in a database, may be subject to multiple threats based on how the information is used, stored and transmitted.
Another approach that combines some elements of survey methodology and the Delphi method is to review lists of publicly reported security breaches for patterns, especially for particular types of attacks that might affect your organization. The reviewers should be security professionals who can assess the relevancy of the incidents to the organization in question.
Take, for example, the list of security breaches maintained by the Privacy Rights Clearinghouse (http://www.privacyrights.org/ar/ChronDataBreaches.htm). In June 2006, 40 incidents are listed, including information theft from financial services firms, healthcare firms, government agencies, educational institutions, and even a major payroll processor. The attacks included stolen hardware, infection by a Trojan horse, hacking into a server, and a vulnerability in an online payment system. As with other methods, this is not a formal, foolproof method; rather, it should be seen as a way of expanding the breadth of information available to risk analysts.
Combining the Results of Multiple Methods
Once you have reviewed the past experience of your organization, gathered publicly available statistics on what other organizations are experiencing, and interviewed knowledgeable information security practitioners, it is time to formulate an overall assessment. There are no hard and fast rules for this, but some things to consider are:
- Some threats do not distinguish by type or size of organization. A lot of malware is designed to attack vulnerable systems anywhere. Be prepared to implement countermeasures to those.
- Weight the likelihood of threats relative to what an attacker might find of value in your systems. It is not always money; customer information and intellectual property are valuable as well.
- Consider generalized categories of specific threats. For example, ransomware is an emerging threat, but it is difficult to gauge how extensive of a problem it will become. Ransomware, however, will use either a form of malware or an attack that breaches system security and allows an attacker to gain control of system resources. Both cases are examples of general threats that can be considered instead of trying to assess the specifics of the more immature threat.
Understanding the threats faced by information systems and information assets is the first part of the risk assessment process. The next step is assessing the value of those information systems and assets.
Assessing the Value of Information
The threat analysis stage addressed the question of "what could happen?" The asset valuation stage considered the question "What would it cost if something did happen?" There are many types of costs to consider; of course, at the end of the day, these will all boil down to monetary costs, but some of them are less obvious than others. For example, there are costs related to:
- Lost sales because an e-commerce site is subject to a distributed DoS (DDoS) attack
- Lost productivity as office workers recover from a virus infection
- Fines due to violations of privacy and confidentiality regulations governing the use of personally identifying customer information
- Lost goodwill and brand equity due to a public disclosure of a major security breach
- Cost of IT staff time to contain and rectify an incident
- Cost of emergency change control actions to apply security patches outside of normal change control procedures
- Cost of lost intellectual property, such as trade secrets
- Cost of contacting customers and replacing compromised assets, such as ATM cards when the numbers of those cards are disclosed in a security breach
Three costs that should be considered when assessing the value of an asset are:
- Replacement costs
- Opportunity costs
- Compliance costs
Different types of assets will have different types of costs; most losses will have some replacement costs but may not incur either of the other two costs.
Replacement Costs
Replacement costs are the costs of acquiring new hardware, software, and data to bring the availability of resources back to the same point before the loss. These costs are relatively easy to estimate. For example, the cost of replacing a stolen laptop is basically the cost of replacing the hardware and configuring the device according to the organization's standards. The cost of replacing the data on the hard drive of the stolen laptop may also be relatively small if regular backups of the device were performed.
Replacement costs do not include the cost of lost confidential data often found on laptops.
Replacement costs are realized in a comparatively short timeframe; other costs, such as those related to market opportunities, may take longer to manifest themselves.
Opportunity Costs
Opportunity costs are associated with changes in market position that adversely impact a business. The losses of customer goodwill and brand equity are opportunity costs because they adversely impact the businesses' ability to conduct future business. How badly does a publicly disclosed security breach affect a business? Consider two examples:
- BusinessWeek reported a 2005 study by the Ponemon Institute that found that 20 percent of customers left a business that suffered a security breach while another 40 percent were found to be considering other vendors.
- The security breach that disclosed information about 40,000,000 credit card customers cost CardSystems Solution, Inc. its business. Major credit card companies stopped using its services and the assets of the company were eventually acquired by a biometric authentication provider.
The consequences of a competitor gaining access to trade secrets, strategic documents, and other confidential information could be quite high. For example, the theft of a computer aided design (CAD) document containing details of a popular product could allow an unscrupulous competitor to have a knock-off version to market much faster than it otherwise could have. According to CIO magazine, the aggregate costs of intellectual property theft are estimated to be at least $250 billion annually in the United States and $600 billion a year globally. The costs of intellectual property losses are the fourth leading cause of financial loss according to the 2006 CSI/FBI Computer Crime and Security Survey, after viruses, unauthorized access, and the loss of laptops and mobile devices.
If the loss of assets and the cost to customer loyalty and brand equity are not enough motivation, there are also potential costs due to compliance violations.
Compliance Costs
Markets are often very good at reflecting the true costs of an economic operation. If a manufacturer spends $100 for resources and $200 for labor to produce one unit of a product, that manufacturer will sell the product for no less than $300. This system works well as long as all the costs to manufacture a product are realized by the producer and consumer of the product. Things break down when the cost of an action is borne by someone else.
Take pollution, for example. During the course of generating a product, the manufacturer may discharge pollutants in the air and water. If there is no cost for this, neither the producer not nor the consumer bear a cost; the people living around the manufacturing plant, however, do incur the cost of that pollution. The technical term for this type of problem is "negative externality," and one method for controlling these negative externalities is government intervention. Over the past several years, there has been a willingness of governments to step in and regulate the negative externalities related to privacy.
The disclosure of private information—such as financial records, Social Security numbers, and healthcare records—has a potential cost for the person whose information is disclosed. For example, at least 800 cases of identity theft followed the disclosure of private information from a consumer data broker. The company did not incur direct costs associated with the identity theft, but like those unfortunate enough to live in the vicinity of a polluting factory, they suffered the consequences.
Government regulations related to privacy are designed to give organizations economic incentives that are not provided by the market. Governments, ranging from state to national to transnational, are implementing privacy regulations. Some sources of current regulations are:
- U.S. Health Insurance Portability and Accountability Act (HIPAA)
- California SB 1386
- Canadian Personal Information Protection and Electronics Document Act (PIPEDA)
- Australian Federal Privacy Act
- European Union Directive 95/46/EC Data Protection Directive
- European Union Directive 2002/58/EC Directive on Privacy and Electronic Communications
Consequences of violating these regulations vary and can be severe. The HIPAA rule includes steep fines as well as prison penalties. A violation can result in a $50,000 fine, 1 year in prison, or both. If the violation is done by making false pretenses, the penalties rise to $100,000 and 5 years in prison. When the violation is done for financial gain, the penalties rise to $250,000 and 10 years imprisonment.
Regulations are effective when enforced and there is some debate about the level of enforcement of the HIPAA regulation. The Washington Post reported in June 2006 that HIPAA enforcement is lax but the same cannot be said of all government regulations. For example, Choice Point, a consumer data broker, agreed to pay $10 million in civil penalties and $5 million in consumer redress to settle U.S. Federal Trade Commission charges that the company violated privacy regulations and federal law resulting in the compromise of 163,000 personal information records.
Compliance costs must be taken into account when assessing the value of information assets, and one should be careful to consider all applicable regulations. For example, a company based in Illinois but doing business with customers in California is subject to California privacy regulations. Global organizations have even more regulations to contend with when doing business in the European Union, Canada, Australia, and other countries.
The three types of costs—replacement, opportunity, and compliance costs—form the foundation for understanding the value of information related to information theft. After conducting an analysis of threats and the value of assets, you can move to the next stage of the risk assessment process: quantitative analysis.
Quantitative Analysis
In many ways, the quantitative analysis stage is the easiest part of risk analysis. The threats to information assets are documented and the value of information assets have been identified; next, you must simply put the two pieces of information together to calculate a measure of the risk realized by each asset. This section will be divided into three parts:
- Components of risk measurements
- Calculating risk measures
- Example risk measurement scenario
The first step in this process is to define some terminology.
Components of Risk Measurements
Measurements of risk are made up of several constituents:
- Exposure factor
- Single loss expectancy (SLE)
- Annualized rate of occurrence (ARO)
- Annualized loss expectancy (ALE)
Exposure factor is the percent of an asset that is lost due to exposure to a threat. For example, a server destroyed in a flood is completely lost, so the exposure factor is 100 percent. A server hacking attack in which design documents are stolen may have an exposure factor of 40 percent because the files are still of value to the victim but their competitive advantage has diminished.
An SLE is the value of an asset lost in one instance of a realized threat. For a design valued at $100,000 with an exposure factor of 40 percent, the single loss expectancy is $40,000. Formally, an SLE is the value of the asset times the exposure factor.
The ARO is the number of times a threat will be realized in 1 year. If 10 laptops are expected to be stolen this year, the ARO is 10. If an event is expected to occur less than once per year, the ARO is less than one. For example, if a database access control breach is expected once every 4 years, the annualized rate of occurrence is 0.25.
Finally, the ALE is the SLE times the ARO. If the SLE of an event is $40,000 and the ARO is 0.25, the ALE is $10,000.
The components, along with the value of an asset, determine the monetary risk associated with each asset.
Calculating Risk Measures
A common goal of the risk analysis exercise is to quantify the monetary value of the risk to which an organization is exposed. To do so, consider all assets, and for each asset, determine the ALE for each threat to the asset. The sum of all ALEs for all assets and all threats is the monetary value of the risk to which an organization is exposed in a one-year period.
The formulas for this calculation are as follows:
- Monetary value of annual risk to organization = Sum of the monetary values of the annual risk of each asset
- Monetary value of annual risk to an asset = Sum of ALEs for each threat to the asset
- ALEs = (SLE) × (ARO)
- SLE = (Asset value) × (Exposure factor)
An example helps to illustrate the use of these formulas.
Example Risk Analysis Scenario
Consider an organization that has determined that its information assets are subject to the following threats:
- Disruptive malware attack
- Information theft by system hacking
- Information theft due to laptop theft
- Information theft due to spyware, Trojan horses, and other malware
- Natural disaster, such as flood and fire
The organization has also identified the following information assets and their respective values (see Table 7.2)
| Asset | Value |
| Customer database | $500,000 |
| Servers and network infrastructure | $200,000 |
| Desktop devices | $120,000 |
| Laptops | $60,000 |
| Trade secrets and proprietary designs | $400,000 |
Table 7.2: Example information assets and values.
The next step is to assign to each asset the threats than can cause a loss to it (see Table 7.3)
| Asset | Threat | Value |
| Customer Database | Information theft by system hacking | $500,000 |
|
| ||
| Information theft by laptop theft | ||
| Information theft by spyware, Trojan Horses, and other malware | ||
| Servers and network infrastructure | Disruptive malware attack | $200,000 |
|
| ||
| Natural disaster | ||
| Desktop devices | Disruptive malware attack | $120,000 |
| Natural disaster | ||
| Information theft by spyware, Trojan Horses, and other malware | ||
| Laptops | Disruptive malware attack | $60,000 |
| Natural disaster | ||
| Information theft by spyware, Trojan Horses, and other malware | ||
| Information theft by laptop theft |
| |
| Trade secrets and proprietary designs | Information theft by spyware, Trojan Horses, and other malware | $400,000 |
| Information theft by laptop theft | ||
| Information theft by system hacking |
Table 7.3: Threat categories relevant to the asset are assigned to each asset.
Next, you must use the information derived in the first two stages of the risk analysis process to calculate the monetary impact of each risk to each asset. Table 7.4 shows the full set of calculations.
| Threat | Value | Exposure Factor | SLE | ARO | ALE |
| Information theft by system hacking | $500,000 | 0.20 | $100,000.00 | 0.10 | $10,000 |
| Information theft by laptop theft | 0.05 | $25,000.00 | 0.20 | $5000 | |
| Information theft by spyware, Trojan Horses, and other malware | 0.05 | $25,000.00 | 0.15 | $3750 | |
| Disruptive malware attack | $200,000 | 0.20 | $40,000.00 | 2.00 | $80,000 |
| Natural disaster | 0.10 | $20,000.00 | 0.25 | $5000 | |
| Disruptive malware attack | $120,000 | 0.20 | $24,000.00 | 2.00 | $48,000 |
| Natural disaster | 0.05 | $6,000.00 | 0.25 | $1500 | |
| Information theft by spyware, Trojan Horses, and other malware | 0.10 | $12,000.00 | 0.30 | $3600 | |
| Disruptive malware attack | $60,000 | 0.20 | $12,000.00 | 2.00 | $24,000 |
| Natural disaster | 0.05 | $3,000.00 | 0.25 | $750 | |
| Information theft by spyware, Trojan Horses, and other malware | 0.10 | $6,000.00 | 0.30 | $1800 | |
| Information theft by laptop theft | 0.50 | $30,000.00 | 0.20 | $6000 | |
| Information theft by spyware, Trojan Horses, and other malware | $400,000 | 0.01 | $4,000.00 | 0.30 | $1200 |
| Information theft by laptop theft | 0.10 | $40,000.00 | 0.20 | $8000 | |
| Information theft by system hacking | 0.20 | $80,000.00 | 0.10 | $8000 | |
| Totals | $1,280,000 |
|
|
| $206,600 |
Table 7.4: Full risk analysis calculations for an example scenario.
Table 7.4 shows that, for the example scenario, the organization faces a set of risks totaling $206,600 per year. In terms of allocating resources, the organization would ideally spend only up to that amount each year to protect its information assets.
Some assumptions are implied in the calculations, including:
- The asset value includes the cost of fines and other regulatory penalties if the asset is compromised.
- The ARO calculations may assume some countermeasures are already in place. For example, a disruptive malware attack twice a year may be based on the use of desktop antivirus applications managed by end users who might not update antivirus signatures as frequently as they should. Also, the organization may not use network-based antimalware applications.
- Exposure factors are appropriate for the example organization; actual rates of exposure will vary among organizations
Use Risk Analysis Results
Given the finds and the caveats about assumptions, what can an organization do with this information? It can allocate resources according to type of threat. For example, the cost of a disruptive malware threat in this example totals $152,000 annually. In addition, the cost of information theft by spyware, Trojan horses, and other malware is $9150. The organization could rationally spend more than $160,000 per year on malware countermeasures.
This analysis also shows the threat of natural disasters, while real, appears to amount to only
$7250 per year. A rational allocation of resources will dedicate more to additional countermeasures to malware than to natural disasters, which are reasonably well addressed.
Risk analysis helps you to understand and quantify the nature of threats to information assets. It also provides the information needed to rationally allocate resources to particular types of threats and to specific assets. It does not, however, dictate what you should do. For example, executives might review a risk analysis and decide that the organization cannot afford the countermeasures needed; in that case, the organization will have to live with the risk. In other cases, the organization may decide not to deploy countermeasures but rather shift the risk to another party by buying insurance.
Once risks are understood and selected countermeasures are in place, an organization will have the ongoing tasks of monitoring information use and corresponding threats.
Monitoring Information Use and Threats
The level of monitoring done in any environment will vary according to the security needs, risk tolerance, and resources of an organization. A large financial institution or military facility may have more comprehensive monitoring than a midsized company or small civilian agency. Regardless of the level of monitoring done, IT infrastructures should include three basic areas of monitoring:
- User events
- Network and host events
- Application events
The goal of monitoring is to ensure that policies and procedures are followed (although auditing does this as well, but more formally and less frequently) and that any unusual events are discovered and addressed as soon as possible.
Monitoring User Security Events
User security events are related to the actions of users and their interaction with information systems. Most of the activities carried out by users are not relevant to security monitoring. For example, there is often no need to track activities with desktop applications in most environments. There may be a need to track particular applications, such as the company's financial system. It is also helpful to track OS programs related to security, especially those related to:
- Login/logout
- Security policy setting programs
- Encryption settings
- Password policies
- Assignment of privileges to users and roles
- Commands executed
As Figure 7.2 shows, OSs, such as Windows XP, allow administrators to finely tune which userrelated security events are monitored. In many cases, successful use of a privilege or program is not all that interesting. In fact, tracking too much detail can easily generate such a large volume of data that it becomes more of an encumbrance than an aid in security monitoring.
The failed attempt to use a program or privilege can be an indication of an attempted security breach. Try not to generalize from a single failed attempt to logon, open a file, or execute a command requiring elevated privileges. In most cases, it is more likely that a user made a mistake than an attacker is trying to access the system. If, however, multiple attempts are made to use a particular program or access a restricted object, the activity should be investigated. A single event does not make a pattern; when multiple events cross the threshold of coincidence, the audit logs of user activity can be a source of detailed information about types of events and when they occurred.

Figure 7.2: Event monitoring can be tailored to the specific needs of an organization.
Network and Host Security Events
Networks deliver and manage so much traffic that monitoring them can be difficult because of the deluge of logging data. Nonetheless, it is important to monitor activities at multiple levels of the network architecture.
Security breaches can occur at multiple levels, including:
- At the address resolution protocol (ARP) level—For example if there are unauthorized changes to Ethernet/Internet Protocol (IP) pairings
- OS changes on a host
- New services introduced to a network
- Exploitation of vulnerabilities in network software
- DoS attacks
One of the challenges in monitoring network and host security events is correlating data from several security devices. For example, an ARP-level monitor may detect a change in the MAC address associated with a particular IP address. This is followed by changes to OS files on several hosts. Shortly thereafter, anomalous patterns appear in the network traffic as if a new service or application has started transmitting substantial amounts of data. There may also be evidence in firewall logs about port scans and blocked access attempts. How can all this data be organized and analyzed?
This is a current challenge for security professionals. Tools are available for collecting and analyzing security data from multiple sources, but correctly correlating data has its challenges. For examples, timestamps on different devices may not be synchronized.
A security breach of a host is sometimes detected by changes made to OS files. Host intrusion detection systems (HIDSs) can detect changes by comparing message digests for a file taken at two different times. For example, when a new server is installed and configured, a file-based HIDS is run to create message digests, also known as hashes, for important OS and application files. The HIDS is then executed on a regular schedule, calculating the message digests again for each of the tracked files. If the message digests are different, the file has changed.
Message Digests
Message digests are functions that take an arbitrarily long input string (for example, a file) and output a fixed string that is used as a signature for that input string. A commonly used message digest is the MD5 algorithm developed by Ron Rivest of MIT and RSA Security. It has been in the public domain since 1992. The algorithm generates a 128-bit string that uniquely identifies a string. For example, the previous paragraph in this chapter generates the MD5 hash of: 146C7CF99CE91CCB010489CB98925D70
However, when the period at the end of the first sentence is changed to a comma, the resulting MD5 hash is unlike the original:
8CB93E614B4833371B8D5D334D6A2189
Message digest functions are designed so that it is very unlikely that any two input strings will generate the same hash value, although it can happen. Another important property is that for any hash value, it is virtually impossible to determine the input string that generated the hash.
The MD5 algorithm has been implemented in C, Java, and Perl; a command-line utility (used to generate the previous examples) is available at http://www.fourmilab.ch/md5/.
Rootkits are a form of malicious software that poses significant challenges to HIDSs that depend upon file change detection. Rootkits modify the behavior of the OS in such a way that the HIDS is not provided with accurate information. A rootkit, for example, might change the system procedures that open and read files and control access to files that have been manipulated by other malware or an attack. Rather than returning accurate information about the altered file, the compromised OS functions could return information based on the original state of the file, thus avoiding detection by the HIDS.
Monitoring networks and hosts depends upon a trusted computing platform. It is essential that hosts and network devices are protected from rootkits that compromise the platform.
Application Events
Application events are changes in the state of a program; although many are of no interest from a security monitoring perspective, others can indicate unauthorized changes or uses of a program. The types of events logged and the level of detail provided will vary between applications. Application monitoring often focuses on performance and less so on security aspects of the program. This is understandable given the nature of application monitoring.
Additional code is required in an application to write event information to a log file and to generate useful information within the log. For example, it takes much less code to write a generic error module that logs a program stack dump than it does to implement a detailed debugging and logging system within an application. In addition, the nature of today's Web applications, which may run on clusters of servers with many threads executing simultaneously, makes the task even more challenging. When application logging is available, it can provide valuable information such as:
- Authentication details
- Execution of particular modules
- Details of data changes, before and after the changes
- Startup and shutdown of the application
Again, as with host and network monitoring and user event monitoring, too much detail can hinder rather than help the monitoring process.
Overall, many aspects of monitoring can be automated with the use of event triggers and alerts. For example, if the number of unsuccessful attempts to log into a privileged account exceeds a predefined threshold, an alert message is sent to the systems administrator. Of course, there is the possibility that these alerts indicate a substantial security breach that calls for incident response procedures.
Incident Response
An incident is a security breach that jeopardizes the confidentiality, integrity, or availability of information assets. Even if an organization has well-established security policies and procedures, uses sound software engineering principals when developing software, implements reasonable patch management procedures, and deploys countermeasures in accordance with a risk analysis, security breaches can still occur. Such a breach could exploit what has come to be known as a zero-day vulnerability.
A zero-day vulnerability is one that is exploited by an attacker before, or on the same day as, the vulnerability becomes known to legitimate security researchers or to the vendor that produced the program. There is no way to directly prevent such an attack because, by definition, there is no patch for the vulnerability. Attacks can be thwarted by other countermeasures, for example, a firewall that blocks the port used by the vulnerable application or a content filtering program that detects malware to be injected into the system using the vulnerability. Problems like zero-day vulnerabilities are one of the justifications for defense-in-depth strategies.
No one security measure can prevent all attacks and even countermeasures, complex systems in themselves, are subject to bugs and vulnerabilities. Defense-in-depth approaches mitigate the risk of any one countermeasure failing. In spite of the best planning and execution, security conscious organizations should prepare for security breaches with incident response plans.
These plans should include several steps:
- Identification
- Containment
- Elimination of threat
- Restoration of services
- Post-incident analysis
Systems administration and information security staff should know prior to an incident what their roles are. Organizations should include clear instructions on reporting and escalation procedures to ensure appropriate management and IT staff are informed and involved in the process.
Identification
The identification stage of incident response occurs when monitoring procedures trigger an alert or a systems administrator, developer, or user notices an anomaly in system operations. The objective of identification is to distinguish between a true security incident and other anomalies. IDSs and OS logs can provide preliminary information to help make the determination. Other systems, such as antivirus applications, may provide detailed information, such as precise identification of the malware that has infected a system. When an incident is confirmed, the incident response team shifts attention to containing the damage of the attack.
Containment
During the containment stage, the objective is to isolate the threat and minimize damage to systems and operation. The team responding to an incident should follow established procedures that govern their responses. For example, once an incident has been identified, the incident response team will need to determine how to contain the damage. Options include:
- Shutting down the compromised systems
- Disconnecting compromised systems from the network
- Disconnecting the subnet used by compromised systems but keeping the systems online to gather more information about the attack
- Shutdown selected services (for example, ftp and telnet)
- Monitor system activity and collect information, such as IP traffic to and from the compromised systems
In addition, if legal proceedings are likely to follow the attack, data should be copied to a forensically sound backup.
The exact steps the response team should take will depend upon the nature of the attack, the risk of spreading to other systems, and the cost of shutting down services. As the nature of attacks varies, it is important to keep management involved because, at some point, choices to be made may require judgment calls based on business objectives and the organization's risk tolerance. Once the threat is contained, the next step is elimination of the threat.
Threat Elimination
The objective of threat elimination, also known as eradication, is to remove the threat and consequences of the threat from a system. In cases in which part of the OS, applications, or data have been compromised, this step might require sanitizing the system and reinstalling software and data from backups. In addition, the vulnerability that allowed the attack to occur must be addressed. This may be done by patching vulnerable applications, changing access controls, or removing privileges from compromised accounts and resetting passwords. It is important to remember that it is the root cause of the attack, not just the symptoms of the breach, that must be eliminated.
Restoration of Services
Once the threat has been eliminated, the incident response team's next task is to restore service. In some cases, backup devices are used to restore services while the primary system remains offline for further analysis or eradication operations.
When systems are restored from backups, it is important that the backups not re-introduce the vulnerability. For example, if a piece of malware has been dormant on a server for several weeks, it may be preserved on backup tapes as well. This is not an issue when the attack is manifested at the same time the vulnerability is exploited, for example, when a worm causes a buffer overflow and starts to execute malicious code. Security incidents are disruptive and sometimes costly, so when one does occur, you might as well learn as much as possible from it.
Post-Incident Analysis
The last stage of incident response is post-incident analysis. The goal of this stage is to understand how the attack occurred, what countermeasures failed (if any), and what can be done to prevent such an attack in the future. In some cases, such as a zero-day attack, security teams may look for changes to existing countermeasures that could have thwarted the attack even though the specific vulnerability still existed. When the cause of the problem was a procedural failure (for example, a patch was not applied as it should have been had procedures been followed), the focus should be on preventing a repeat of that mistake.
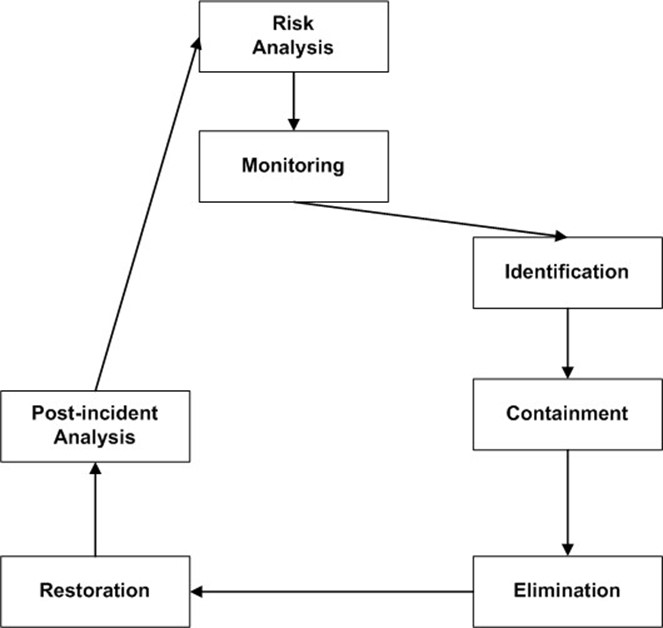
Figure 7.3: Incident response is tightly linked to monitoring as well as risk analysis; the former is the entry point to the incident response process and the latter uses the lessons learned from incident response to improve the quality of risk analysis assessments.
One of the established best practices in information security is preparing for incident response. The time of an attack is not the time to formulate procedures to respond to the incident; the last thing an IT team should do is work out an ad hoc solution. Reporting and escalation procedures should be well defined along with other security policies and procedures.
Summary
Risk analysis is a formal method for determining the value of information assets, the threats to those assets, and the appropriate level of resource to dedicate to countering those threats. The outcome of risk analysis exercises guide the deployment of countermeasures and the establishment of policies and procedures for monitoring user activities, network and host events, and application functioning. When security incidents do occur, formal incident response procedures are executed to minimize the damage, restore service, and learn how to improve the level of security within the organization.